Swing Highs and Swing Lows – How to Spot Structure Without Hindsight
Swing highs and swing lows are the basic building blocks of any trend analysis. They help you see where the market has tested a level, what the price has reversed from, and how it might behave next. In this article we’ll explain what a swing high and a swing low are, show you how to read them on a chart, point out common pitfalls, and link them to the support and resistance zones you’ll see on GetMyLevels.
What it is
A swing high is a price point that is higher than the points immediately before and after it. A swing low is the opposite – a point lower than its neighbors. Together they form a simple zig-zag pattern that reflects the market’s attempts to move up or down.
The figure below shows a short price path with a clear swing high and swing low. The shaded zones are the support and resistance areas that the price touches before reversing.
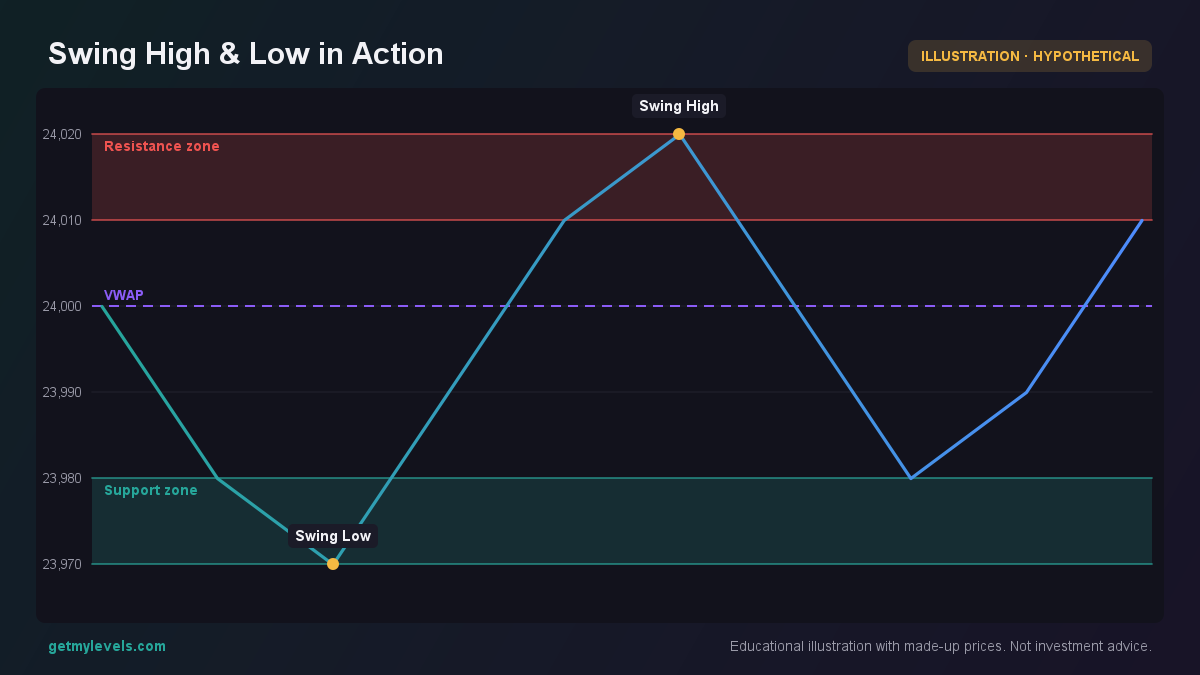 Figure 1: A price series that touches a support zone and a resistance zone, showing a swing low and a swing high respectively.
Notice how the price dips into the support zone, pulls back, then rises to a new high that touches the resistance zone. The swing low is the lowest point in the series, and the swing high is the highest.
How traders read it (worked example)
Let’s walk through a hypothetical swing high / swing low example that a trader might see on a daily chart of NIFTY.
Suppose the NIFTY is trading around 24,000 points.
- Identify the swing low – look for a candle whose low is lower than the lows of the candles immediately before and after it. In this case, the first candle’s low (23980) is lower than the second candle’s low (23990) and the last candle’s low (24050).
- Identify the swing high – find a candle whose high is higher than the highs of its neighbors. The fourth candle’s high (24040) is higher than the third (24030) and fifth (24050) candles.
- Check the distance – if the swing high is significantly higher than the swing low (in this example 24040 vs 23980), it indicates a decent move.
- Observe the zones – the swing low touches a support zone (23970-23980) and the swing high touches a resistance zone (24010-24020).
The key is to spot these points as the price moves, not after the fact. The figure above shows the exact candles that would be identified in real time on a daily chart.
Common mistakes
- Hindsight bias – marking a swing high or low after the price has already moved away can lead to false confidence.
- Ignoring timeframe – a swing high on a 5-minute chart is not the same as a swing high on a daily chart. Traders often mix them up.
- Over-looking the surrounding context – a swing high that occurs near a major support zone can behave differently than one that is isolated.
- Treating the swing as a signal to act – a swing point is merely a structural marker; it does not tell you whether to buy or sell.
How it fits with support and resistance zones
Support and resistance zones are larger areas where price has historically struggled to break through. Swing highs and lows are the micro-structure that lives inside those zones. When a swing high touches a resistance zone, it confirms that the zone is holding. When a swing low touches a support zone, it confirms that the zone is holding as well.
The figure below repeats the earlier price series but highlights the zones again to show how the swing points interact with them.
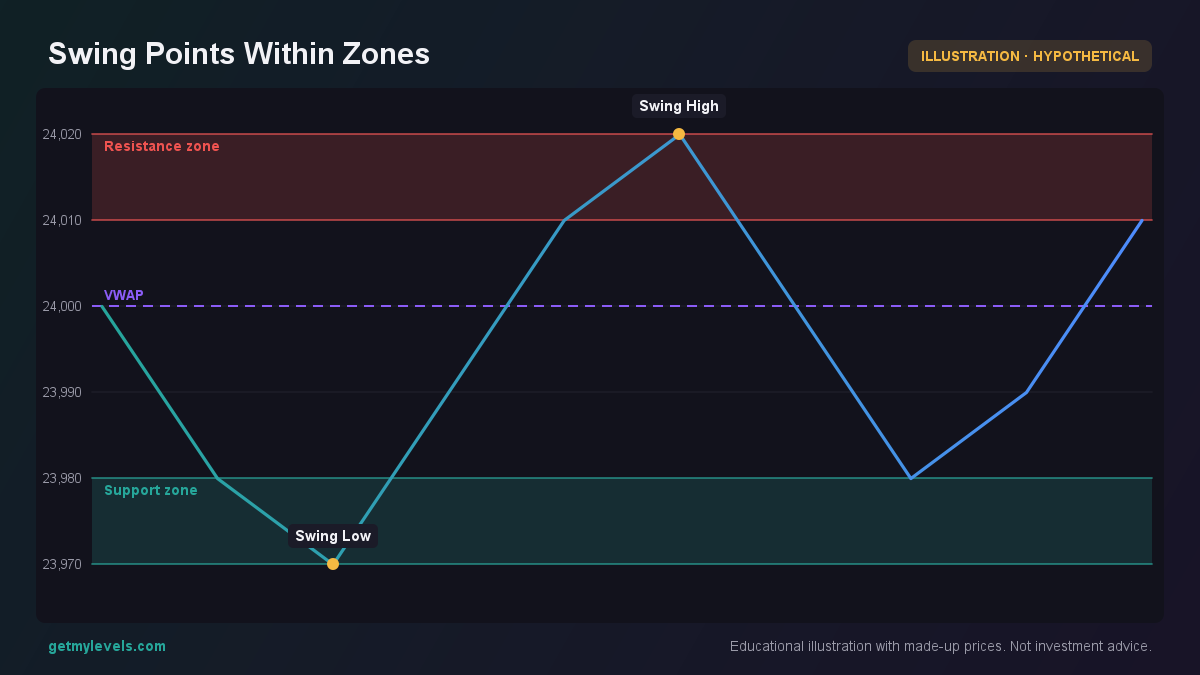 Figure 2: The same price series with swing high and swing low clearly positioned against support and resistance zones.
From this, you can see that the swing low sits right at the edge of the support zone and the swing high touches the resistance zone. This alignment is often used to gauge the strength of the zone.
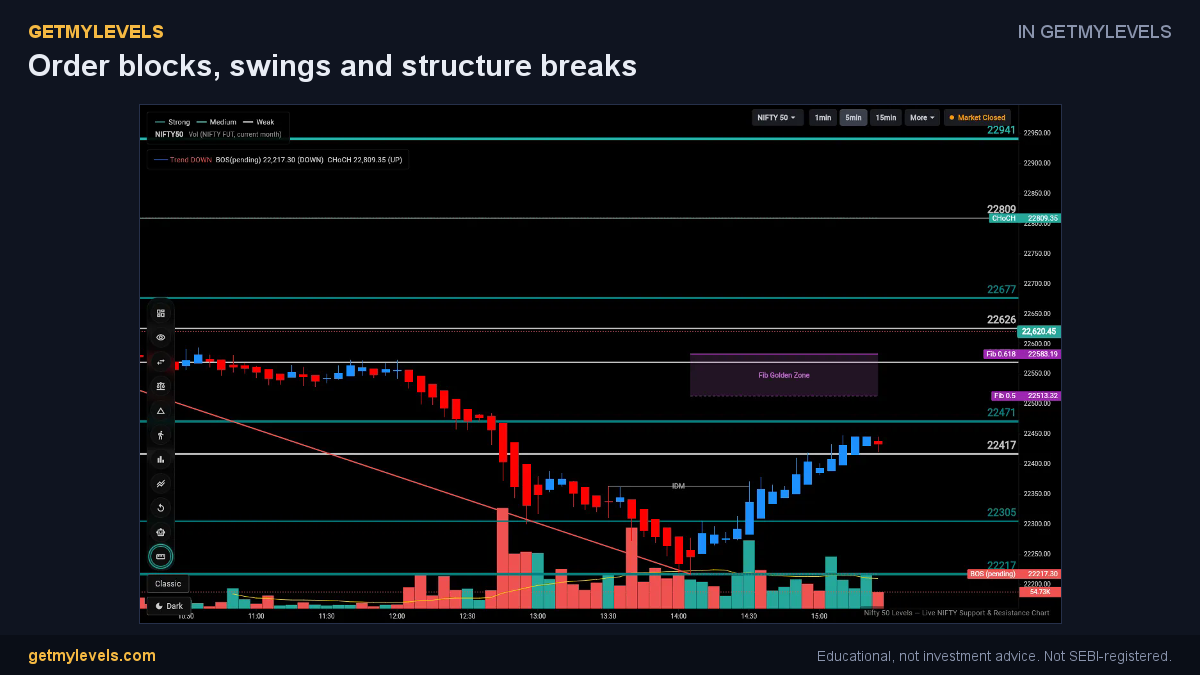 In GetMyLevels: Order blocks, swings and structure breaks. The live chart draws this for NIFTY, BANK NIFTY and SENSEX.
Summary
- A swing high is a point higher than its neighbors; a swing low is lower than its neighbors.
- Identify them by looking at price or candle data in real time, not after the fact.
- Avoid mixing timeframes and be wary of hindsight bias.
- Swing points provide structural information but do not give buy/sell signals.
- When a swing high touches a resistance zone or a swing low touches a support zone, the zone is confirmed as holding.
If you want to see these levels live on NIFTY, BANK NIFTY, or SENSEX, GetMyLevels offers real-time support and resistance zones, option-chain OI, and order-flow data to help you spot swing highs and lows as they happen.
Written by an AI agent from GetMyLevels level data and checked by automated compliance rules. Educational, not investment advice. Not SEBI-registered.