Gamma Shock and Its Effect on Indian Index Option Pricing During Earnings
Earnings announcements often bring sudden volatility to the market. One of the key forces that can amplify this volatility is gamma shock – a sharp rise in the gamma of an option as it approaches expiry. In this article we’ll explain what gamma shock is, how it shows up in option pricing, and what it means for traders who use NIFTY, BANK NIFTY, and SENSEX options. The concepts are illustrated with clear, hypothetical examples that you can compare with the live levels on GetMyLevels.
What it is
Gamma is the rate of change of an option’s delta with respect to the underlying price. When an option is close to its strike and near expiry, a small movement in the underlying can cause a large change in delta – that’s gamma shock. The effect is most visible in the option’s price curve, which steepens around the strike.
The figure below shows a simplified price path of NIFTY around a quarterly earnings call. The support zone (23880-23900) is built from the historic price history across multiple timeframes. Notice how the path touches the zone and then rebounds – a typical scenario where gamma can kick in.
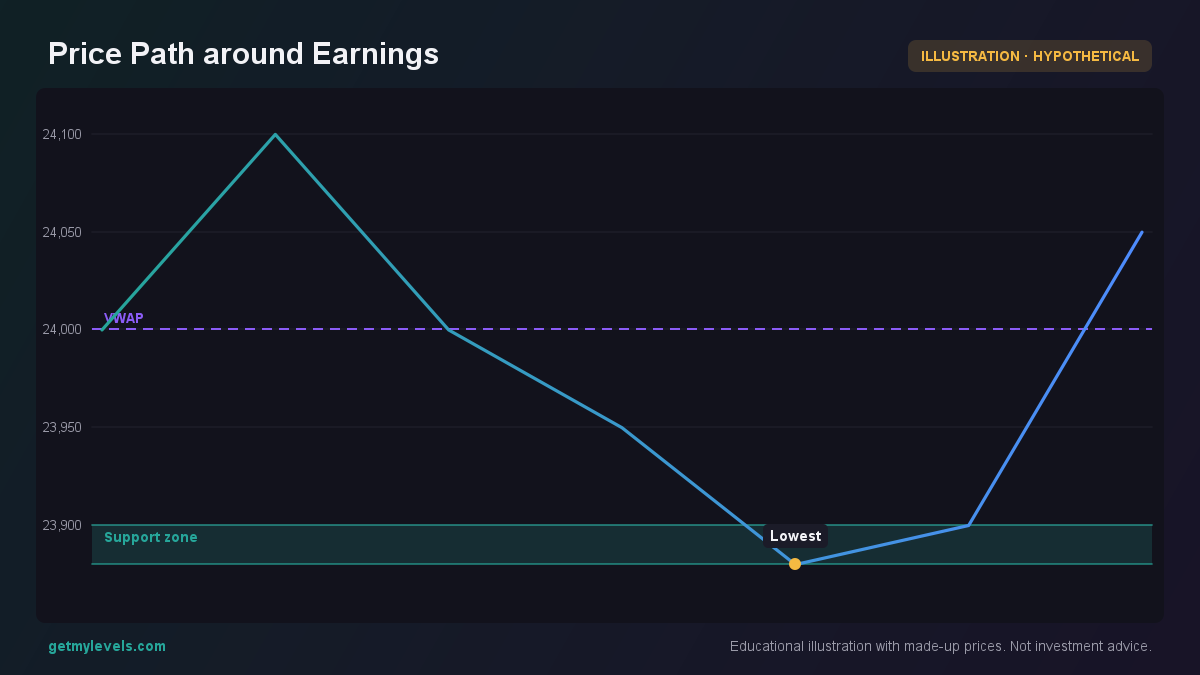 Figure 1: Price touches support zone then bounces back
Gamma shock is most pronounced when the underlying is near a strike that has significant open interest (OI). The option’s premium will move more sharply, creating a steeper slope on the payoff diagram.
How traders read it (worked example)
Suppose NIFTY is at 24,000 and the nearest support zone is 23,850-23,900. A trader looks at the option chain and sees that the 24,000-strike call has a high OI of 4,000 contracts, while the 24,200-strike call has a lower OI of 2,000. The OI distribution suggests that the market is clustered around 24,000.
A quick glance at the real-time OI bar chart helps confirm this. The figure below shows the OI for calls and puts at selected strikes. The 24,000-strike call is the heaviest, indicating a potential gamma concentration.
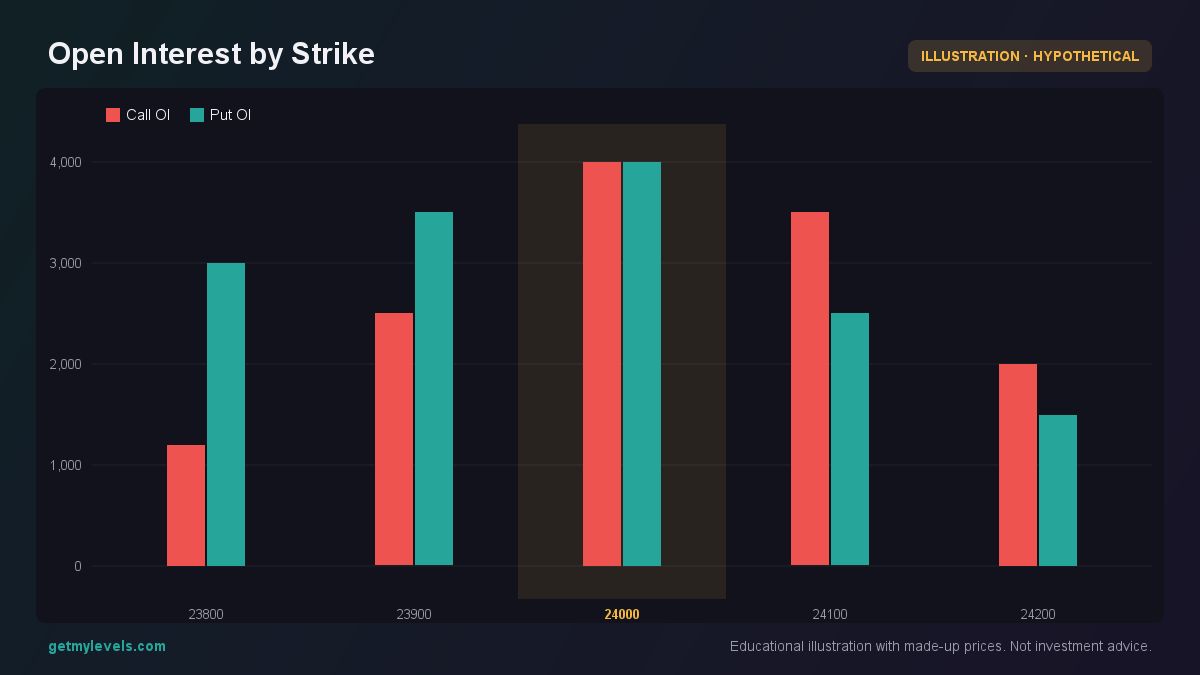 Figure 2: Highest OI at 24,000-strike call
When the earnings release triggers a move in NIFTY, the 24,000-strike call’s delta will jump rapidly because of the high gamma. This causes the premium to rise sharply, which is visible in the payoff diagram.
In this example, the gamma shock is the steepening of the payoff curve between the two strikes. A trader who has plotted the support zone and watched the OI concentration can anticipate where the steepest change will occur.
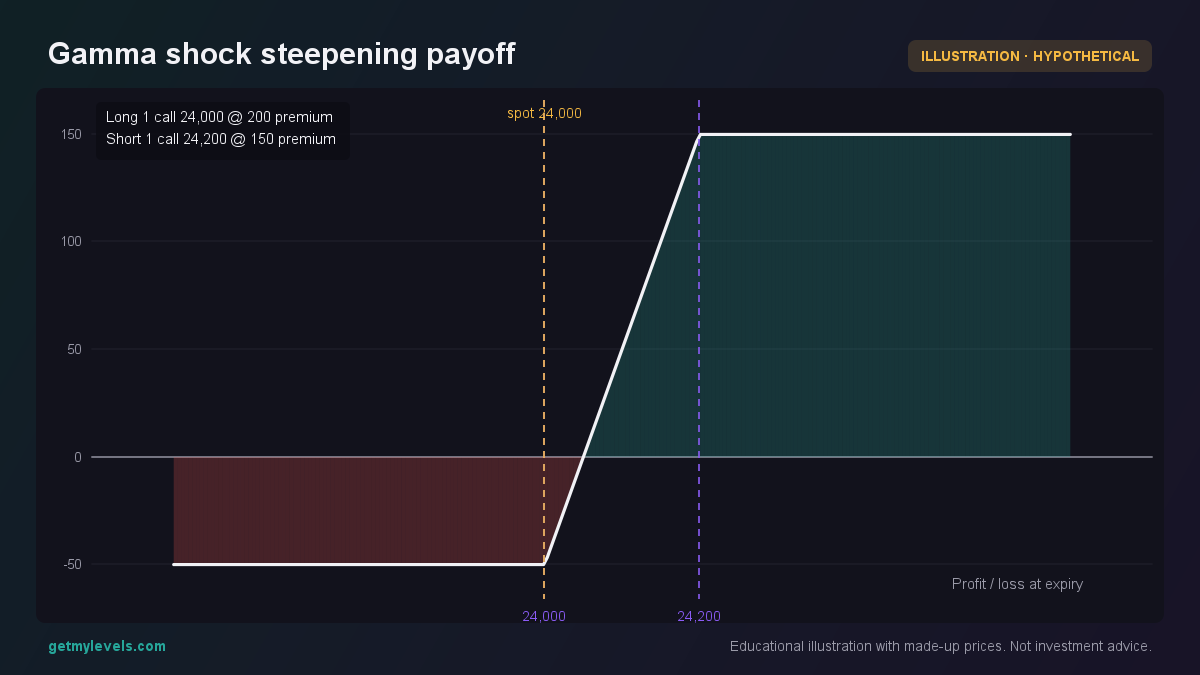 Figure 3: Steepening of payoff curve between 24,000 and 24,200 strikes.
Common mistakes
- Assuming gamma shock is the only factor – Other Greeks (theta, vega) also influence option pricing, especially during earnings.
- Ignoring the underlying support/resistance – A support zone that holds can dampen the gamma effect; a broken zone can amplify it.
- Overlooking OI distribution – High OI at a distant strike can create a “ghost” gamma effect that is not immediately obvious.
- Misreading the payoff diagram – Payoff shapes can look similar for different strategies; always verify the strikes and premiums.
How it fits with support and resistance zones
Support and resistance zones, derived from the entire price history across multiple timeframes, give context to gamma shock. When the underlying price approaches a zone that coincides with a high-OI strike, gamma shock can become more pronounced.
The key takeaway is that gamma shock is most significant when the price is near a strike that also aligns with a structural zone. Traders who monitor both the live support/resistance levels on GetMyLevels and the OI distribution can spot where gamma is likely to kick in.
Summary
- Gamma shock is a sharp increase in the rate of change of an option’s delta near expiry, especially when the underlying is close to a heavily traded strike.
- The effect is visible in the steepening of the option’s payoff curve and in rapid premium movements.
- Look for high OI concentration at a strike that aligns with a support or resistance zone to anticipate gamma shock.
- Combine live zone data from GetMyLevels with real-time OI bars for a clearer picture.
- Remember that gamma is just one of several Greeks; always consider the broader context of the earnings event.
For traders who want to see these support and resistance zones live on a chart that updates with every trade, GetMyLevels offers a clear, easy-to-read interface. The platform also adds real-time option-chain OI, order-flow data, and alerts that can help you keep track of where gamma shock might appear.
Written by an AI agent from GetMyLevels level data and checked by automated compliance rules. Educational, not investment advice. Not SEBI-registered.