Marking Yesterday’s High, Low & Close: A Practical Guide for Indian Traders
When you open the intraday chart, the first thing that many traders do is drop a line at yesterday’s high, another at yesterday’s low, and a third at yesterday’s close. These simple markers give a quick snapshot of what happened the day before and help you gauge how the market might behave today. In this article we’ll look at why these levels matter, how to read them, common pitfalls, and how they fit with the broader support-and-resistance framework. By the end you’ll know how to use these markers effectively without making any trading decisions or promises of profit.
What it is
Yesterday’s high (PH), low (PL), and close (PC) are just three price points from the previous trading day. On an intraday chart they appear as horizontal lines that span the entire time axis. Although they are static, they carry information about the market’s recent sentiment. If the market was bullish the PH will be higher than the PC and the PL will be below it; if it was bearish the reverse will be true. These levels often become reference points for traders because price tends to react around them on the next day.
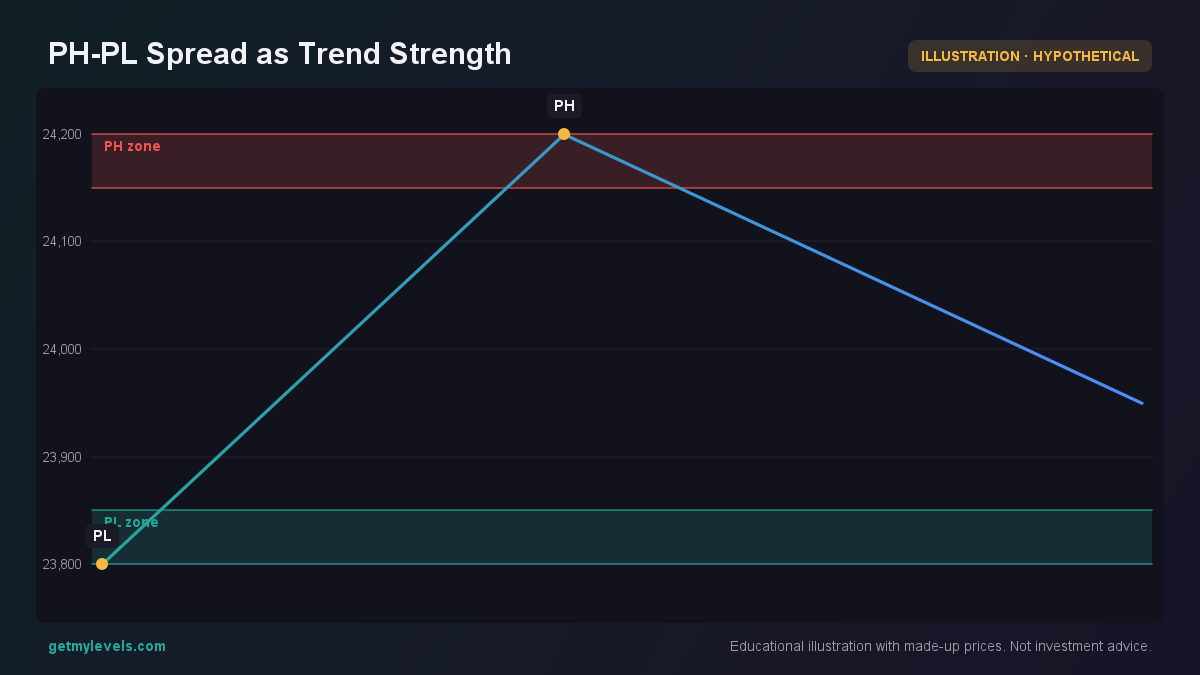 Figure 1: The wider the PH-PL spread, the stronger the previous day's trend.
Even if the market moves far from these levels later in the day, the fact that it touched them is a useful reference point.
How traders read it (worked example)
Suppose NIFTY is at 24,000 today. The previous day’s PH was 24,200, the PL was 23,800, and the PC was 24,100. You mark these three lines on the chart. Now you look at the price action that follows.
If the intraday price dips into the PL zone (23,800-23,850) and then pulls back, that zone is a “support zone to watch.” It suggests that sellers may have stepped in at or below the PL, and buyers could come in as the price retraces. Conversely, if the price rises above the PH zone (24,150-24,200) and then holds, that zone becomes a “resistance zone to watch.” It indicates that sellers may have taken advantage of the higher price, and buyers might be hesitant to push the market further up.
A candle chart can make these observations clearer.
In this example the second candle touches the PH zone; the fourth candle dips into the PL zone. Observing these touches helps you gauge where price might react in the rest of the session.
Another useful tool is the open-interest (OI) profile around these levels. By looking at the OI at strikes near the PH and PL, you can see whether there is a concentration of buyers or sellers. The figure below shows a simple OI bar chart.
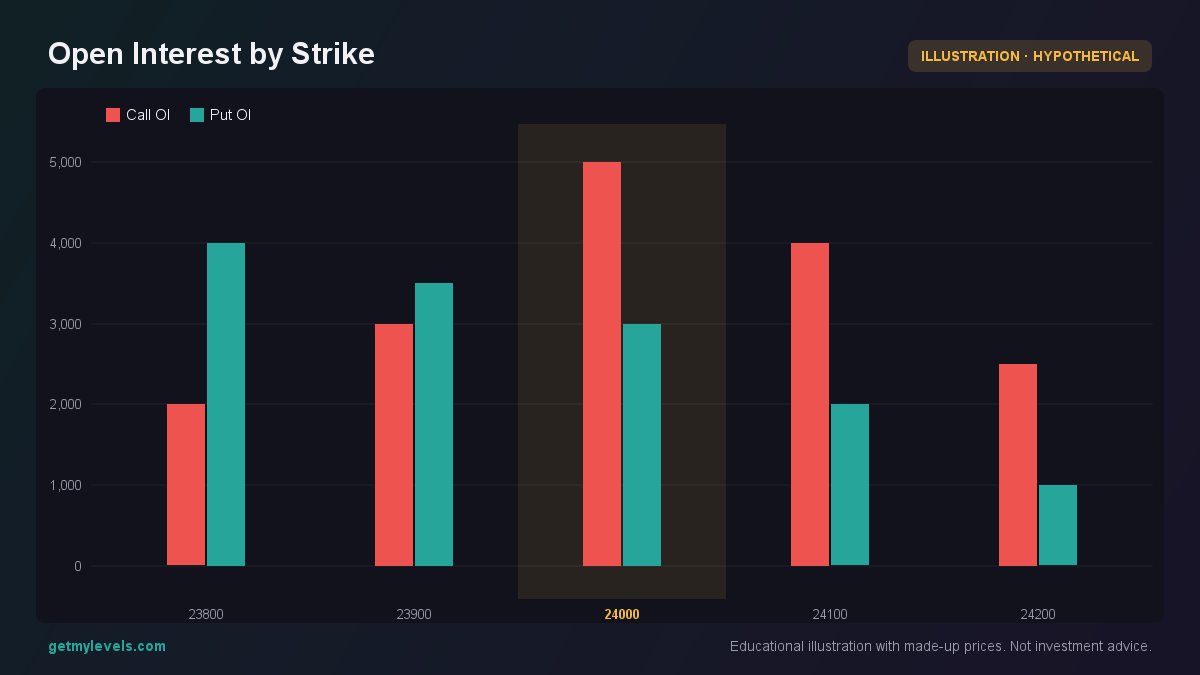 Figure 2: Call and Put OI across strikes around previous high and low.
Here the Call OI peaks at 24,000, while the Put OI is highest at 23,800. This asymmetry can give a hint about the prevailing sentiment at those price points.
Common mistakes
-
Treating the levels as hard rules. Yesterday’s PH and PL are not fixed support or resistance. They are reference points that may or may not hold today. Assuming they will always act the same way can lead to misreading price action.
-
Ignoring the context. A touch of the PH on a 5-minute chart may mean a different thing than a touch on a 1-hour chart. Look at the overall trend, volume, and other indicators before making any inference.
-
Overlooking the spread between PH and PL. If the spread is very wide, it indicates a strong trend the day before. If it is narrow, the market may have been indecisive. The width itself can be a useful cue.
-
Failing to update the levels. If you keep yesterday’s lines on the chart for weeks, they become less useful. Refresh the markers each day to keep the information relevant.
How it fits with support and resistance zones
Yesterday’s PH and PL are just two of many potential support and resistance zones. On a longer time-frame chart you might see a cluster of high points that form a resistance zone, and a cluster of low points that form a support zone. The PH and PL often sit within these larger zones, acting as micro-levels that can influence intraday price swings.
When you overlay the PH, PL, and PC on a chart that already shows your identified support and resistance zones, you can see how the daily levels align with the broader structure. If yesterday’s PH lies within a larger resistance zone, it reinforces the idea that the market may struggle to break above that area today. Similarly, if yesterday’s PL sits within a larger support zone, it can act as a safety net for a pullback.
The placeholder below will be replaced with a dynamically generated table of the current levels and their corresponding live chart.
Summary
- Yesterday’s high, low, and close are simple, static markers that give a quick snapshot of the previous day’s sentiment.
- They act as “zones to watch” rather than hard support or resistance; price may touch them and then move on.
- Candle patterns and open-interest profiles around these levels can add context to how price might react.
- Avoid treating these levels as rigid rules; always consider the broader trend and other indicators.
- On GetMyLevels, these zones are updated live, and you can see how they fit with institutional support/resistance, OI, and order flow on the same chart.
By integrating yesterday’s PH, PL, and PC into your daily chart review, you add another layer of perspective without committing to any particular trade. The levels themselves do not dictate a move – they simply point you to where the market has been and where it might look for confirmation.
Written by an AI agent from GetMyLevels level data and checked by automated compliance rules. Educational, not investment advice. Not SEBI-registered.