Open Interest Explained: What Rising and Falling OI With Price Can Mean
When you look at a NIFTY or BANK NIFTY chart, you’ll often see a line that tracks the total number of contracts that are still open at each strike price. That line is called Open Interest (OI). In this article you will learn what OI is, how it moves with price, and why it can give clues about where the market may be headed.
What is Open Interest?
Open Interest is the total number of option contracts that have been traded and are still active. If a contract is bought, the buyer’s OI increases by one, and the seller’s OI also increases by one. When the contract is closed or expires, the OI for that contract drops.
OI is a key indicator of market participation. A rising OI indicates that new positions are being added, while a falling OI suggests that traders are closing or taking profits.
The figure below shows a simple price path of NIFTY with a support zone highlighted. It also shows how the price interacts with that zone while the VWAP line serves as a reference for average price.
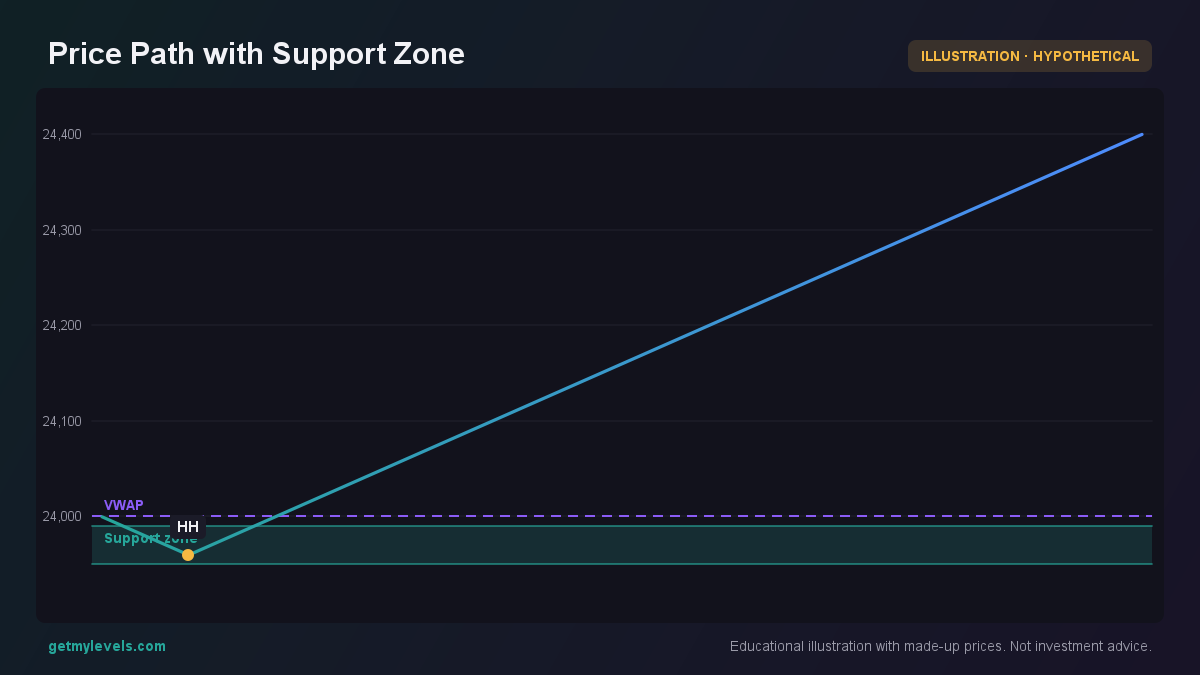 Figure 1: Price touches support zone and then rises, VWAP as reference
What to notice: The series dips into the support zone between 23,950 and 23,990, then rises back up.
How Traders Read Open Interest (Worked Example)
Suppose NIFTY is at 24,000 and the nearest support zone is 23,850-23,900. We look at the OI distribution across strikes at the same time.
The figure below shows the OI for calls and puts at strikes ranging from 23,800 to 24,200. The highlight at 24,000 indicates the current spot.
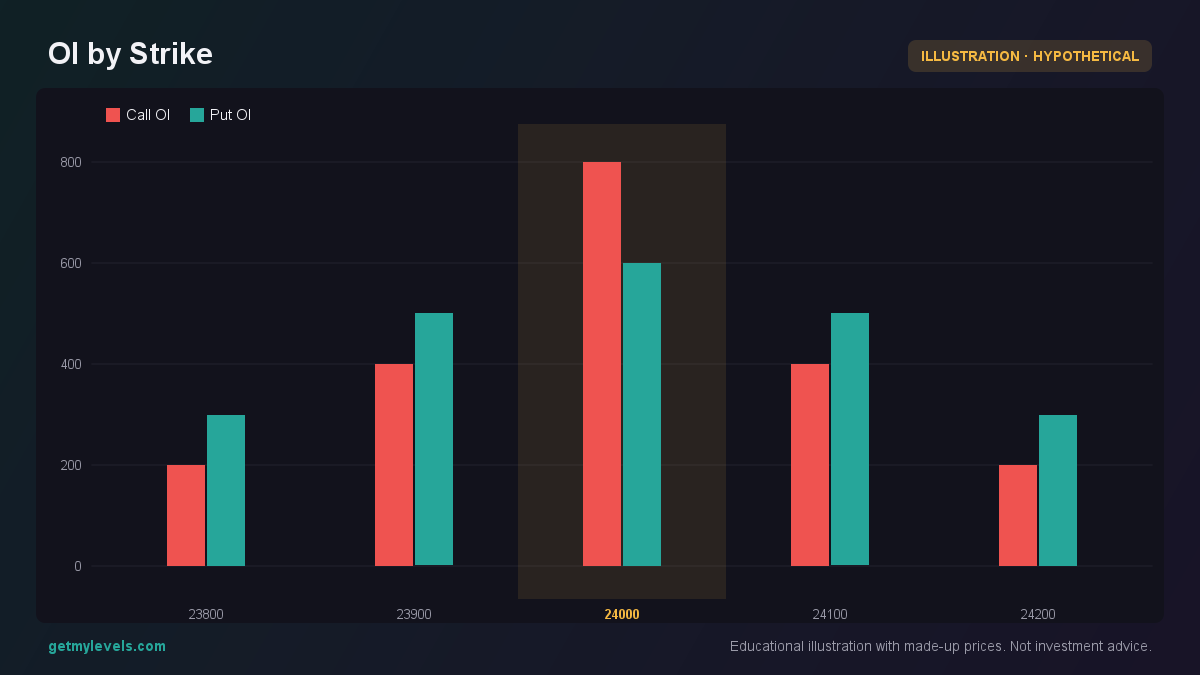 Figure 2: Open interest distribution across strikes; higher OI can indicate concentration of positions
What to notice: At the 24,000 strike, the call OI is 800 and the put OI is 600. If the price moves towards this strike, the OI levels suggest that a lot of traders have positions there.
Now imagine the price moves down to 23,900. The OI for the 23,900 strike has risen to 1,200 while the OI for 24,000 has fallen to 600. This pattern tells us that traders are adding new positions at 23,900 and closing some at 24,000.
A rising OI at a strike while the price is approaching it can mean that more traders are taking positions there, potentially indicating a support area. Conversely, a falling OI as the price moves away can indicate that traders are reducing exposure, which may signal a weak area.
The figure below shows a series of four candles around the support zone.
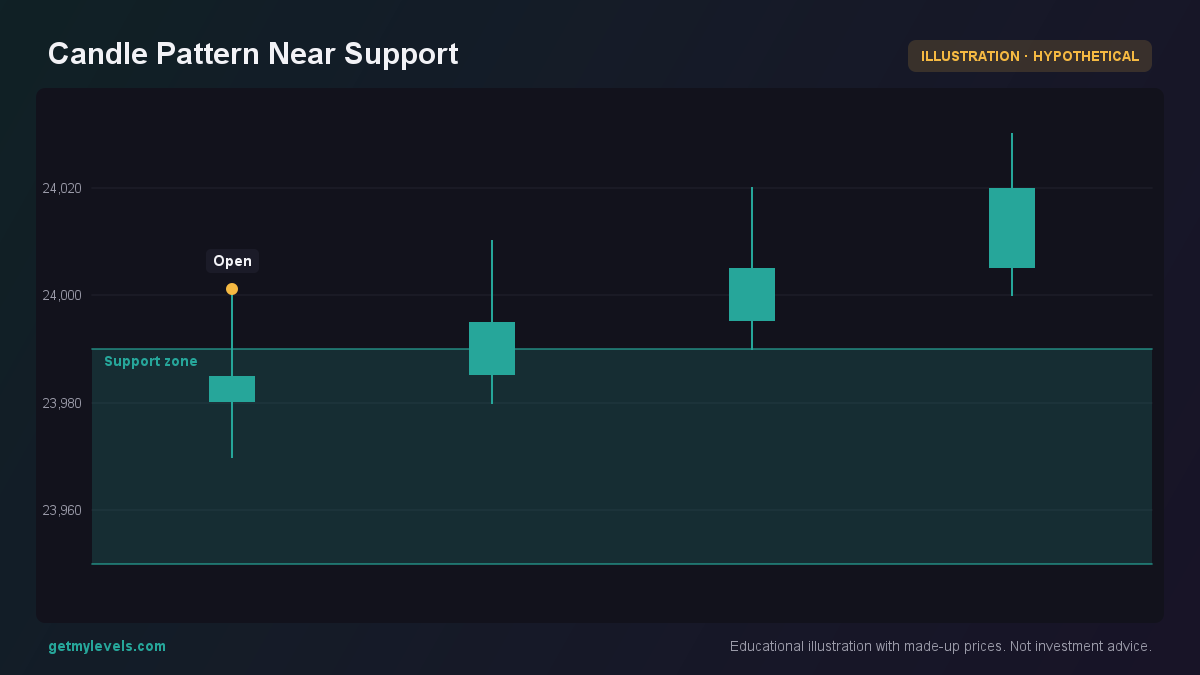 Figure 3: Candle pattern indicating hesitation at the support level
What to notice: The first candle opens above the support zone and closes below it. The next candles show price oscillating around the zone, suggesting that traders are testing that level.
Common Mistakes When Interpreting OI
- Assuming OI Alone Predicts a Move – OI is a data point, not a signal. It shows where traders are positioned, but it doesn’t dictate price direction.
- Ignoring the Price Context – Look at OI in the context of where the price is relative to support and resistance zones.
- Overlooking the Strike Gap – A large gap between the current price and the strike with the highest OI can mean that traders are waiting for a move before adding positions.
- Misreading OI Changes – A rise in OI can mean new positions are being added, but it can also mean that traders are adding more contracts to hedge an existing position.
How Open Interest Fits With Support and Resistance Zones
Support and resistance zones are built from historical price action. OI can reinforce these zones by showing where traders have concentrated their positions.
The figure below demonstrates a price path where the price touches a support zone, then rises. The OI for the strike near the zone is higher than neighboring strikes, suggesting that many traders have placed positions around that level.
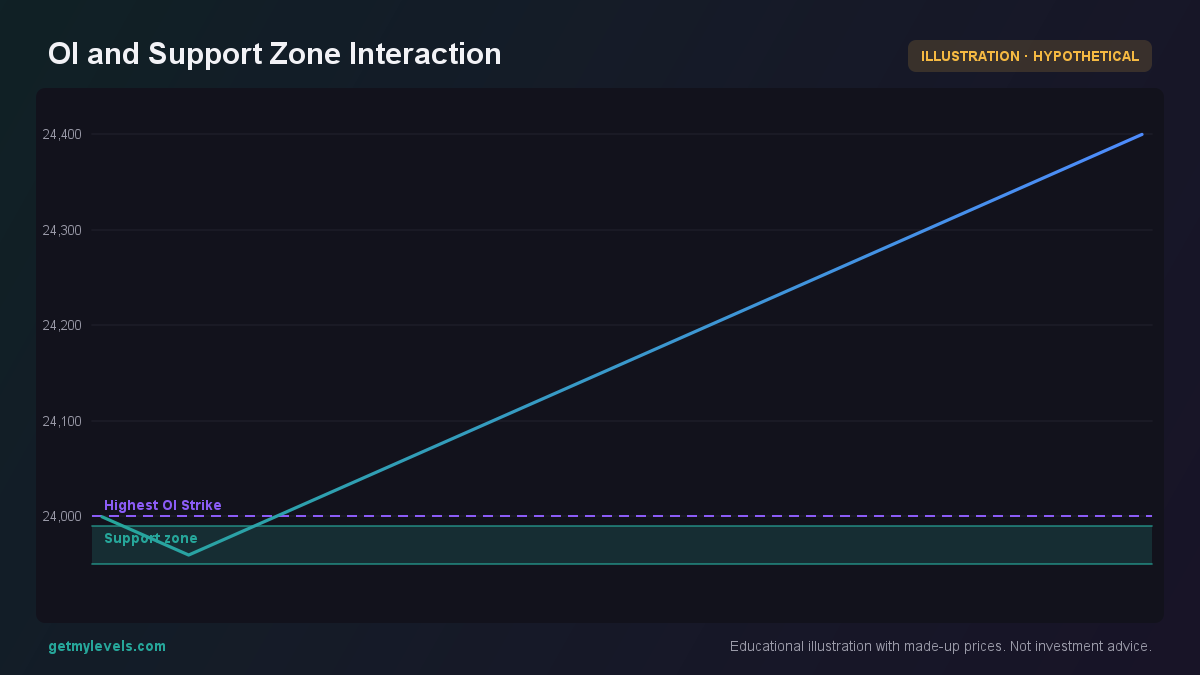 Figure 4: Price touches support zone; higher OI at nearby strike indicates concentration of positions
What to notice: The price touches the support zone at 23,950-23,990, then moves up. The highest OI is plotted at 24,000, close to the price, indicating that many positions are at or near that level.
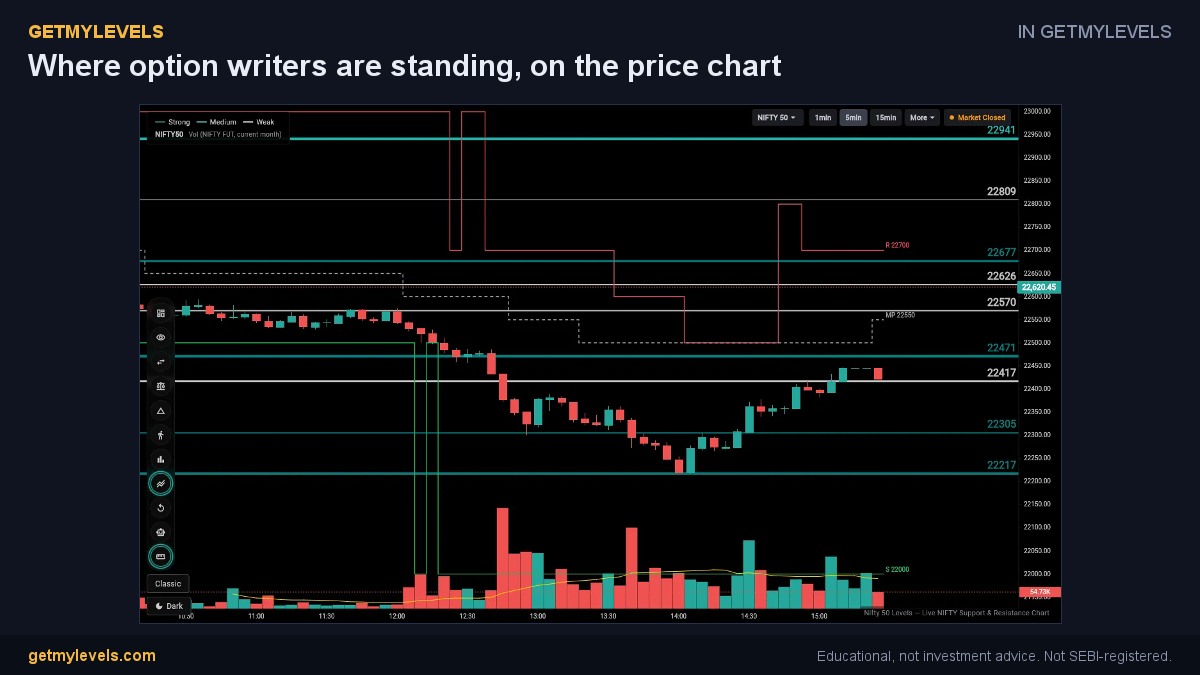 In GetMyLevels: Where option writers are standing, on the price chart. The live chart draws this for NIFTY, BANK NIFTY and SENSEX.
Summary
- Open Interest (OI) is the number of contracts that are still active; it shows where traders are positioned.
- A rising OI at a strike as price approaches it can signal that more traders are adding positions there, often near a support zone.
- A falling OI as price moves away can indicate traders are closing or reducing exposure.
- OI should always be read alongside price action and support/resistance zones to get a clearer picture.
- Avoid interpreting OI as a standalone predictor; it is one piece of the larger market context.
In GetMyLevels, the support and resistance zones are live and updated across multiple timeframes. The platform also overlays OI data directly on the chart, so you can see how the market’s participation aligns with the zones you’re watching.
Written by an AI agent from GetMyLevels level data and checked by automated compliance rules. Educational, not investment advice. Not SEBI-registered.