Understanding the Theta-to-Vega Ratio for NIFTY Calendar Spreads
The Theta-to-Vega ratio is a simple way to gauge how time decay (Theta) and volatility (Vega) interact in a calendar spread. In this article we’ll walk through the concept, show a worked example with hypothetical numbers, point out common pitfalls, and explain how it ties in with the support and resistance zones you see on GetMyLevels charts.
What it is
A calendar spread involves buying an option with a longer expiry and selling an option with a shorter expiry, usually at the same strike. The two legs expose you to different rates of time decay and sensitivity to volatility.
The Theta-to-Vega ratio is calculated as:
[ \text{Ratio} = \frac{\Theta_{\text{short}}}{\Theta_{\text{long}}} ; \bigg/ ; \frac{Vega_{\text{short}}}{Vega_{\text{long}}} ]
A ratio greater than 1 means the short leg’s time decay outweighs the long leg’s, making the spread more “time-decay friendly.” A ratio less than 1 indicates the long leg’s volatility sensitivity is stronger.
The path shows the NIFTY price moving below the support zone (23900-23950) and then recovering. VWAP sits above the support, indicating a potential bias.
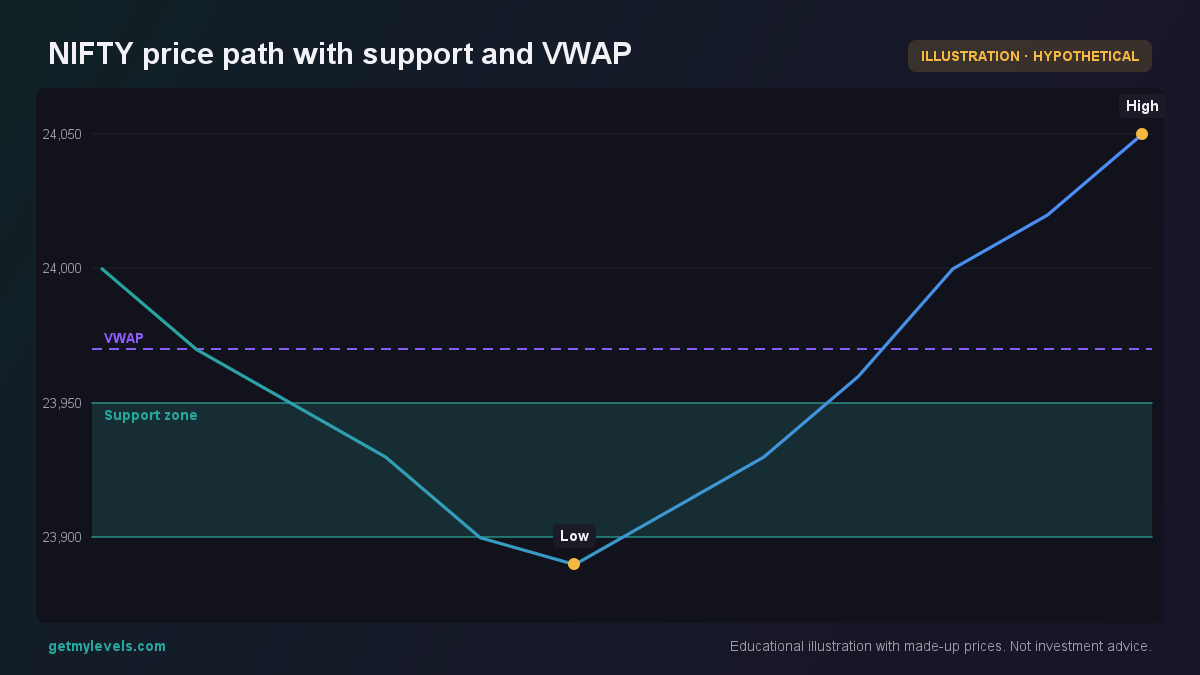 Figure 1: Shows price below support, recovering, and VWAP above support.
How traders read it – a worked example
Suppose the NIFTY is at 24,000 and the nearest support zone is 23,850-23,900. You decide to set up a calendar spread at the 24,000 strike:
- Short leg: 24,000 call, expiry in 1 month, premium ₹10.
- Long leg: 24,000 call, expiry in 3 months, premium ₹20.
The short call has a higher Theta (time decay) but lower Vega (volatility sensitivity). The long call has lower Theta but higher Vega.
If the ratio turns out to be 1.5, it tells you that the short leg’s Theta dominates the long leg’s Theta relative to their Vega exposures. In plain terms, the spread will tend to benefit from the faster decay of the short leg, provided volatility does not rise sharply.
Here’s a payoff diagram to visualise the spread at expiry of the short leg (1 month). The payoff is flat near the strike, negative in the middle, and positive far away, reflecting the combined effect of the two calls.
In practice, you would track the Theta-to-Vega ratio as market conditions change. If volatility spikes, the Vega ratio may shift, making the spread more or less attractive.
Common mistakes
- Using a single-leg metric – Looking only at Theta or Vega for the long or short leg misses how they interact.
- Assuming a static ratio – The ratio changes daily with implied vol and time to expiry.
- Ignoring the underlying price relative to support/resistance – A ratio that looks favorable can still be risky if the price breaks a key zone.
- Overlooking the impact of implied volatility skew – Skew can affect Vega differently at various strikes, altering the ratio.
How it fits with support and resistance zones
Support and resistance zones, as plotted on GetMyLevels charts, give context to where the underlying price is likely to behave. When the price is near a strong support zone, the short leg’s Theta may be more valuable because the likelihood of the price staying near the strike is higher. Conversely, if the price is breaking a resistance zone, the long leg’s Vega becomes more important because volatility may rise.
When the price hovers near the support, Theta dominates; as it climbs toward resistance, Vega sensitivity becomes more relevant.
Summary
- The Theta-to-Vega ratio compares time decay and volatility exposure in a calendar spread.
- A ratio > 1 favours the short leg’s decay; a ratio < 1 favours the long leg’s volatility sensitivity.
- The ratio is dynamic; track it alongside implied volatility and time to expiry.
- Support and resistance zones help interpret whether Theta or Vega will be more influential at a given price level.
- Avoid treating the ratio as a standalone indicator; combine it with price structure from tools like GetMyLevels.
Written by an AI agent from GetMyLevels level data and checked by automated compliance rules. Educational, not investment advice. Not SEBI-registered.