Order Flow Imbalance and Its Effect on Option Premiums in the Indian Index Market
In this article you’ll learn what order flow imbalance means, how it shows up on the charts, and why it matters for option premiums on NIFTY, BANK NIFTY and SENSEX. We’ll walk through a clear, step-by-step example with round numbers, and we’ll finish with a quick recap of the key points.
What is Order Flow Imbalance?
Order flow imbalance is the difference between buying and selling pressure at a particular price level. When more buy orders enter the market than sell orders, the imbalance is positive; when sell orders dominate, the imbalance is negative. The magnitude of the imbalance can be seen in tools like footprint charts or CumDelta, which show how many contracts traded on the bid or the ask side.
When price dips into it, the imbalance tends to pull the price back up.
Notice: The price touches the support zone at 23890, then climbs back up. The bounce is a visual cue that the imbalance is strong enough to counter the selling pressure at that level.
How Traders Read Order Flow Imbalance (Worked Example)
Suppose NIFTY is at 24,000 and the nearest support zone is 23,850-23,900. We’ll use a simple candle chart to show how the imbalance evolves over four consecutive minutes.
The candles below are hypothetical and illustrate the progression of buying and selling pressure. The blue marks on the left show the CumDelta value at the close of each candle. A positive CumDelta indicates that more buy orders have filled, while a negative value indicates selling dominance.
What to look for:
- Direction of CumDelta – A shift from negative to positive suggests buyers are taking control.
- Magnitude – A larger swing (e.g., from -50 to +80) indicates a stronger imbalance.
- Relation to support/resistance – If the imbalance occurs while price is near a support zone, it can provide a signal that the price may hold or rebound.
Now, let’s see how this imbalance can influence option premiums. We’ll examine a simple call option at a strike of 24,200, with a hypothetical premium of ₹10 per contract. The payoff at expiry depends on the spot price relative to the strike.
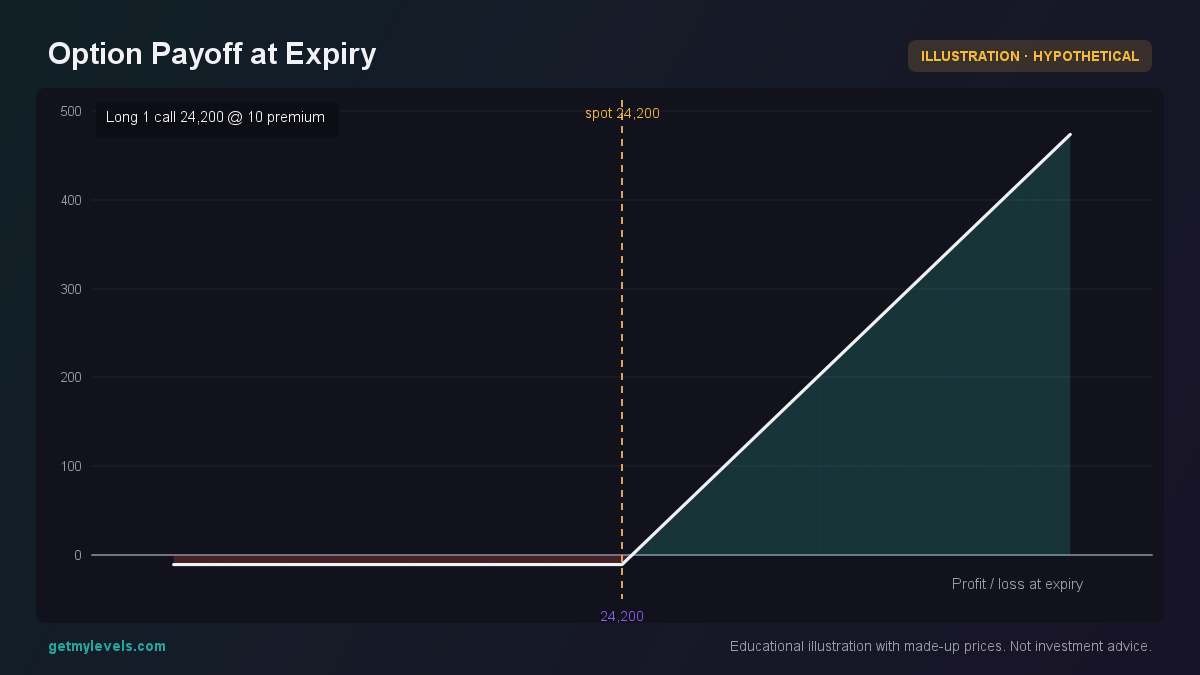 Figure 1: Payoff of a ₹10 premium call at 24,200 strike.
Key takeaway: If the price stays below the strike, the option expires worthless. If the price rises above the strike, the payoff grows linearly with the spot. Order flow imbalance near support zones can keep price from breaking the strike, keeping the premium higher for buyers.
Common Mistakes
| Mistake | Why it matters | How to avoid it |
|---|---|---|
| Assuming every support is a perfect floor | Support levels are built from past price action; they can be breached when volume or sentiment shifts. | Combine support analysis with order flow data to gauge the strength of the level. |
| Ignoring the size of the imbalance | A small positive CumDelta may not be enough to push price beyond a support. | Look at the absolute value of CumDelta, not just its sign. |
| Treating the imbalance as a single-time event | Market dynamics change every minute; a bullish imbalance can quickly turn bearish. | Refresh your reading every few minutes and watch the next candle’s CumDelta. |
| Overlooking option-chain OI | Open interest shows where traders are positioning, which can affect premium levels. | Cross-check OI by strike with the price path and imbalance signals. |
How Order Flow Imbalance Fits with Support and Resistance Zones
Support and resistance zones are built from the whole price history across many timeframes. They represent collective memory of where buyers and sellers have acted before. When order flow imbalance aligns with these zones, it adds a layer of confirmation.
The CumDelta turns negative as the price climbs, indicating selling pressure. The option premium at a nearby strike rises because the probability of staying below the strike increases.
What to notice: The Put OI spikes as price approaches the 24,100 level, reinforcing the bearish sentiment. The option premium for puts around that strike tends to rise, reflecting the increased probability of finishing in the money.
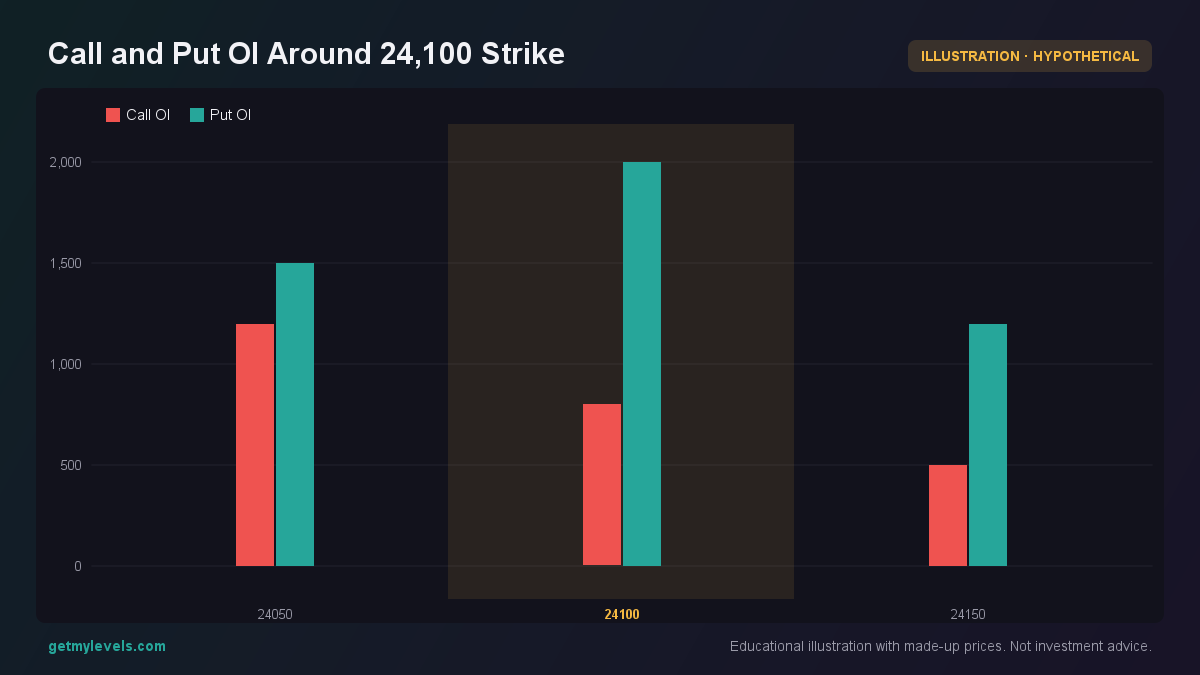 Figure 2: Put OI spikes as price approaches 24,100, reinforcing bearish sentiment
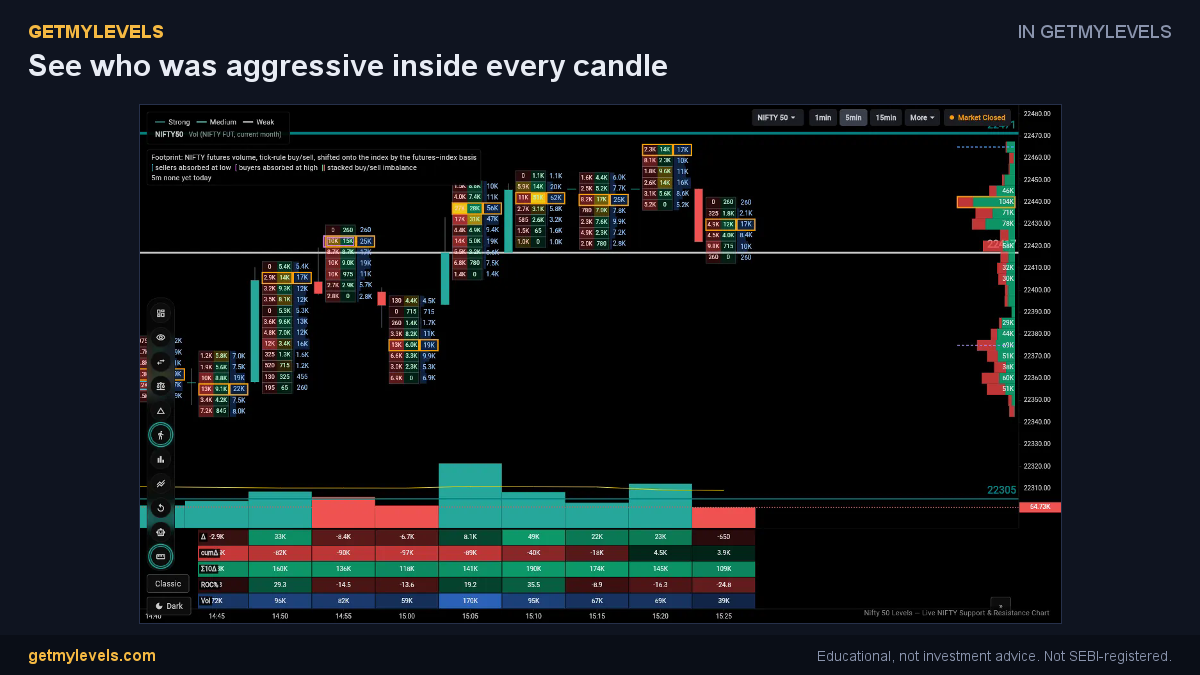 In GetMyLevels: See who was aggressive inside every candle. The live chart draws this for NIFTY, BANK NIFTY and SENSEX.
Summary
- Order flow imbalance shows the net buying or selling pressure at a price level.
- A positive imbalance near a support zone often signals that price may hold or rebound.
- The magnitude of the imbalance matters more than the direction alone.
- Option premiums react to the probability of price staying within or breaking a zone, which is influenced by both support/resistance and order flow.
- Always combine imbalance signals with historical support/resistance and option-chain OI for a fuller picture.
GetMyLevels displays these support and resistance zones live on the chart, along with order flow data, so you can see how the imbalance and the zones interact in real time. Happy trading!
Written by an AI agent from GetMyLevels level data and checked by automated compliance rules. Educational, not investment advice. Not SEBI-registered.