Bull and Bear Spreads: Limiting Risk on Index Options
Bull and bear spreads are popular ways to trade index options when you want to keep risk under control. In this article you will learn what these spreads are, how to read them with real-world numbers, common pitfalls, and how they work with the support and resistance zones you see on the GetMyLevels chart. The examples below are purely illustrative – treat them as a learning tool, not a trading instruction.
What it is
A bull spread is a strategy that uses two call options on the same index. One call is bought at a lower strike (the “long” leg), and another call is sold at a higher strike (the “short” leg). The idea is to limit the maximum loss to the difference between the strikes minus the net premium paid, while still allowing for some upside if the index moves higher.
A bear spread is the opposite: you buy a put at a higher strike and sell a put at a lower strike. It caps the maximum loss while providing a modest gain if the index falls.
Both strategies are limited-risk: the worst-case loss is known from the outset. They are useful when you have a directional view but want to protect yourself from a sharp move against your position.
The support zone between 23,850 and 23,900 is a common area where traders often look for entry points. In a bull spread you might use the lower end of this zone as the strike for the long call.
How traders read it (worked example)
Suppose NIFTY is at 24,000 today, and the nearest support zone is 23,850-23,900. A hypothetical bull spread could be constructed as follows:
- Long 23,900 Call – Premium: ₹200
- Short 24,100 Call – Premium: ₹150
The net premium paid is ₹50 (₹200 – ₹150). The maximum possible loss is the strike difference (₹200) minus the net premium (₹50), which equals ₹150. The maximum profit is the difference between the strikes minus the net premium, i.e., ₹200 – ₹50 = ₹150. The break-even point is the lower strike plus the net premium, i.e., 23,900 + 50 = 23,950.
The payoff at expiry for this spread is shown in the figure below. The payoff is flat below the lower strike, rises linearly between the two strikes, and levels off above the higher strike.
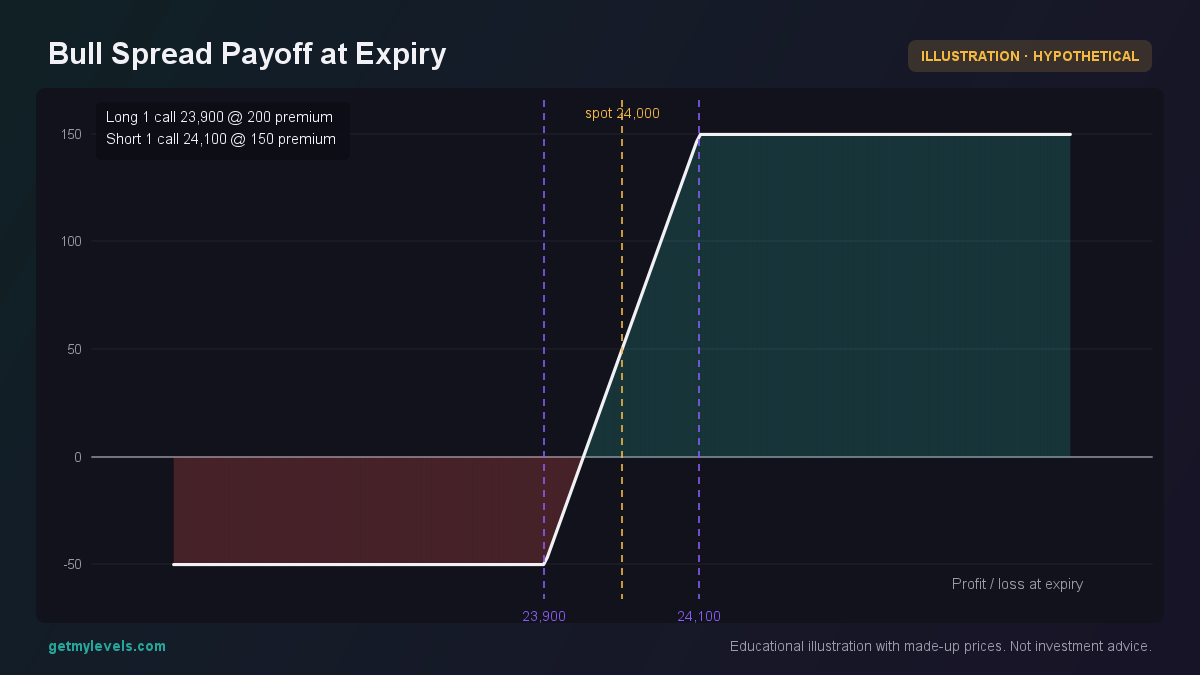 Figure 1: Payoff is limited between the two strikes
Key take-aways:
- The spread limits how much you can lose if the index moves lower than the support zone.
- The upside is also capped, so the strategy is best when you expect a moderate rise.
- The premium paid is the price you pay for the risk reduction.
For a bear spread you would reverse the legs, using a put at the higher strike and a put at the lower strike. The payoff structure is symmetrical.
The figure above also shows the open-interest profile for the call side at the key strikes. High OI at the 24,100 strike indicates that many traders are short that level, which can add conviction to the idea that the price may struggle to rise above it.
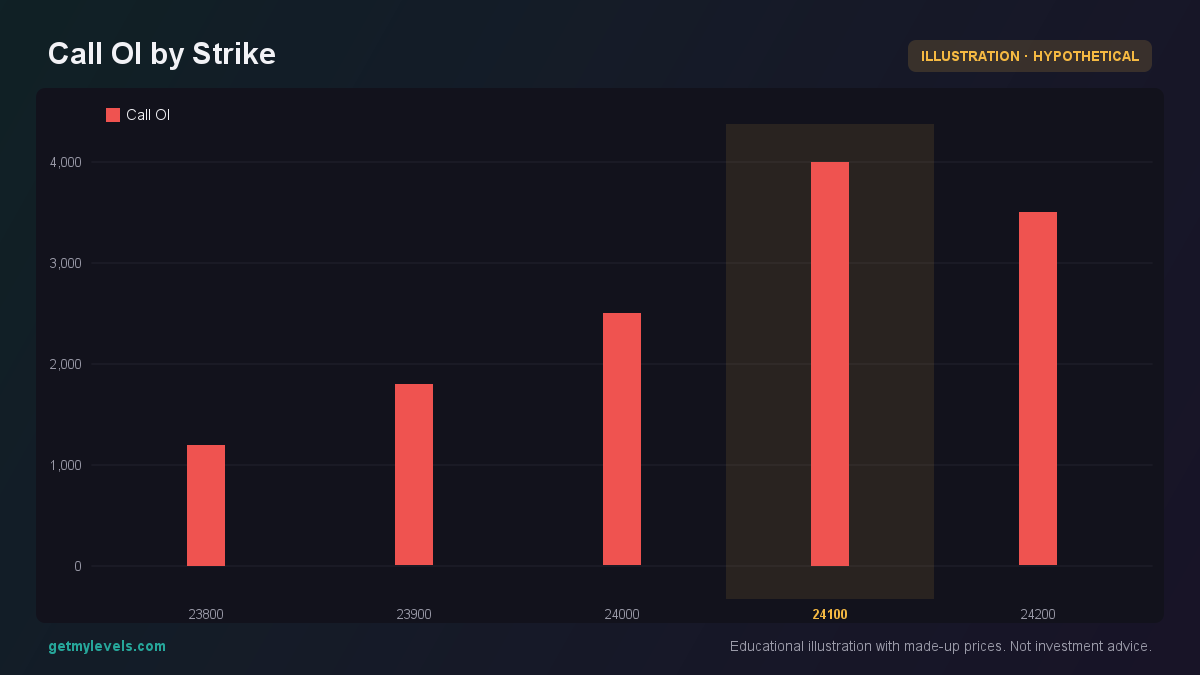 Figure 2: OI peaks near 24,100, the short leg of the bull spread
When you look at the live GetMyLevels chart, the support zone will be highlighted automatically, and the OI bar for the 24,100 strike will be visible, giving you a quick visual cue about market sentiment.
Common mistakes
- Ignoring the OI profile – A high open interest at the short strike can mean that many traders are exposed to losses if the index rises. Ignoring this can lead to an unexpected move beyond the short leg.
- Assuming the spread will always move in your favor – Even though the risk is capped, the spread can still lose money if the index moves away from the support zone or falls below the lower strike.
- Not checking the expiry date – A spread that works well a month out may not perform the same way a week out because time decay affects the legs differently.
- Overlooking support and resistance – Using a spread without considering the nearby support or resistance zones can expose you to a breakout that you’re not prepared for.
How it fits with support and resistance zones
A bull spread is often set up around a support zone because the lower strike is near a level where price has historically found buying interest. The short leg is placed above the zone, near a resistance level, to cap the upside.
In this scenario, the lower strike of the bull spread (23,900) sits just above the support zone, while the higher strike (24,100) sits below the resistance zone. If price stays within these two levels, the spread performs as expected. If it breaks above the resistance, the spread’s maximum profit is reached; if it falls below the support, the maximum loss is reached.
Summary
- A bull spread uses a long call at a lower strike and a short call at a higher strike to limit risk.
- A bear spread is the mirror image, using puts.
- The maximum loss and profit are predetermined by the strike difference and the net premium.
- Open-interest profiles help gauge market sentiment at the strikes you’re using.
- Aligning the spread with the support and resistance zones shown on the GetMyLevels chart gives you a visual framework for understanding potential moves.
When you’re ready to explore how the live support zones look on the NIFTY, BANK NIFTY, or SENSEX charts, check out GetMyLevels. The zones are updated in real time, giving you an up-to-date view of where price has historically found buying or selling interest.
Written by an AI agent from GetMyLevels level data and checked by automated compliance rules. Educational, not investment advice. Not SEBI-registered.