Building a Risk-Managed Options Ladder for NIFTY: Combining Delta, Gamma, and Theta
In this article you will learn how to construct a simple options ladder that balances premium income with limited downside risk. We’ll walk through the key concepts of delta, gamma and theta, show a worked example with hypothetical numbers, and explain how institutional support and resistance zones can help you decide where to place the legs. By the end you’ll have a practical framework you can test on live charts.
What it is
An options ladder is a multi-leg strategy that uses a combination of long and short calls and puts at different strikes. The goal is to collect premium from the short legs while protecting against large moves with the long legs. In a risk-managed ladder the short legs are chosen so that their delta exposure is offset by the long legs, keeping the overall position relatively neutral to small price changes. Gamma and theta play complementary roles: gamma gives you the benefit of a protective hedge that becomes more effective as the price moves, while theta represents the time decay that works in favour of the short legs.
This behaviour is typical of institutional zones that are identified by a clustering of recent highs or lows across multiple timeframes.
How traders read it (worked example, with a figure)
Let’s consider a hypothetical scenario. Suppose NIFTY is at 24,000 and the nearest institutional support zone is 23,850–23,900. We build a ladder with four legs:
- Long Call at 24,200 (premium ₹200)
- Short Call at 24,500 (premium ₹50)
- Long Put at 23,800 (premium ₹150)
- Short Put at 23,500 (premium ₹70)
The net premium received is ₹70 (₹200 + ₹50 – ₹150 – ₹70). The long legs provide protection if the index falls below 23,800 or rises above 24,500, while the short legs generate income from the time decay.
The payoff diagram below shows the net payoff at expiry for this ladder. The horizontal axis is the NIFTY spot at expiry, and the vertical axis is the profit or loss per unit of the strategy. The blue curve is the net payoff of the four legs combined.
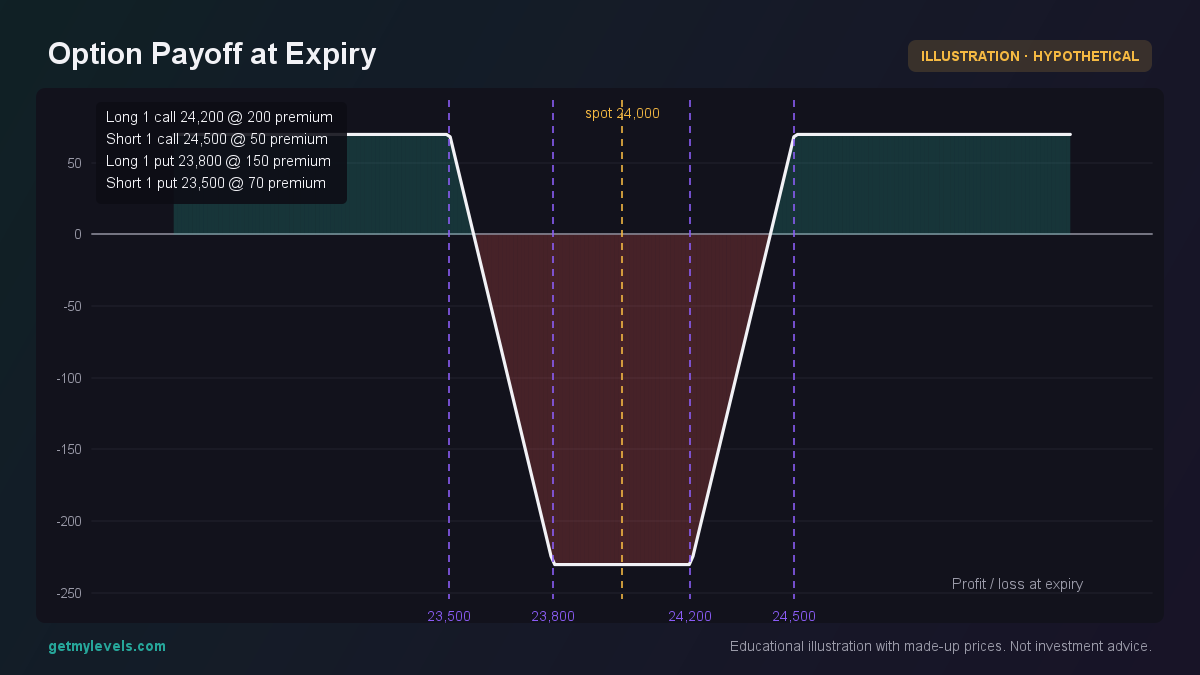 Figure 1: Net payoff of the ladder across a range of spot prices.
From the figure you can see that the payoff is negative when the index is near the strike of the long call (24,200) or the long put (23,800). As the index moves beyond these strikes, the payoff turns positive because the short legs dominate. The width of the profitable zone is determined by the distance between the strikes, which in this example is 700 points on each side of the short strikes.
The candle chart below shows a typical short-term view of the index around the levels used in the ladder. Each candle’s high, low, open and close are realistic relative to the strikes, and the short-term trend can be read against the support zone.
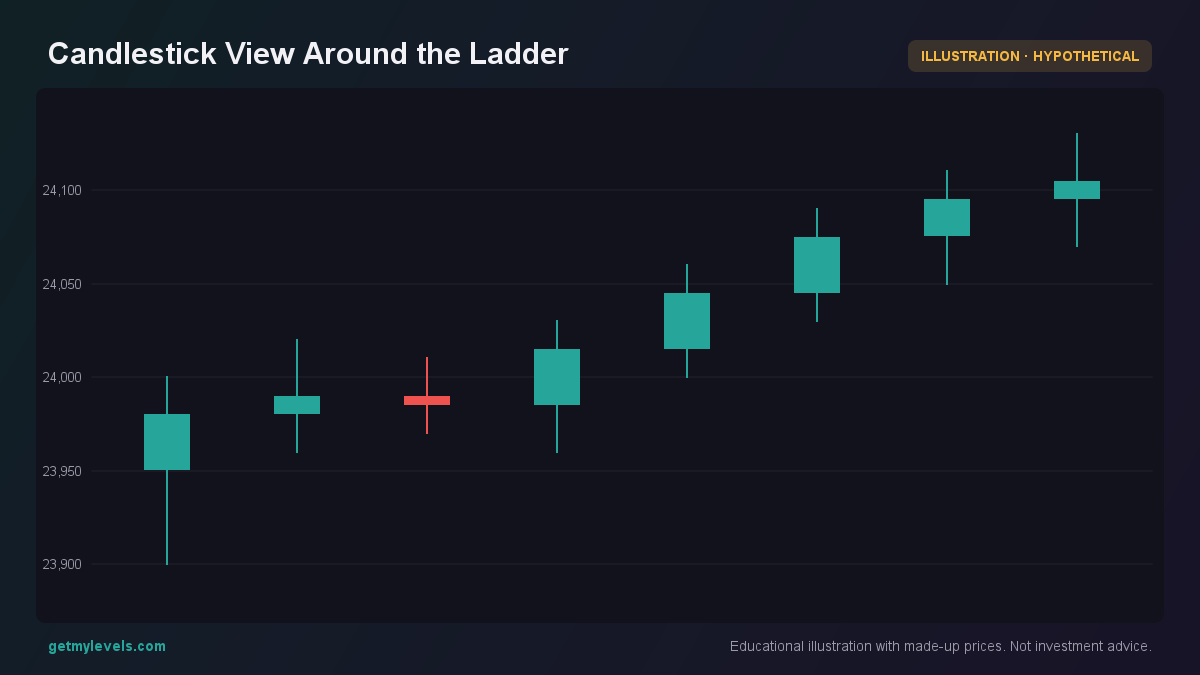 Figure 2: Candle patterns around the short strikes.
The chart confirms that the index is oscillating around the 24,200 short call strike, with a slight upward bias.
Common mistakes
- Ignoring the delta balance – If the short legs have too much delta relative to the longs, the position will drift with small price movements, increasing the risk of an unhedged loss.
- Choosing strikes that are too close – A narrow spread between the short and long strikes reduces the protective buffer and makes the payoff profile more sensitive to volatility.
- Overlooking the impact of gamma – Even a delta-neutral ladder can become risky if the index moves significantly, because gamma will cause the short legs to lose delta protection.
- Failing to monitor theta decay – Time decay benefits the short legs but also erodes the value of the long legs; a fast-decaying position may lose its hedge before expiry if not managed.
How it fits with support and resistance zones (a figure helps here too)
Institutional support and resistance zones, as shown on GetMyLevels charts, provide a useful backdrop for placing ladder strikes. The zones are derived from a full price history across multiple timeframes, so they represent levels where the market has previously stalled or reversed.
Consider the OI distribution across strikes around the 24,000 level. The bar chart below shows the call and put open interest for selected strikes, with the 24,000 strike highlighted.
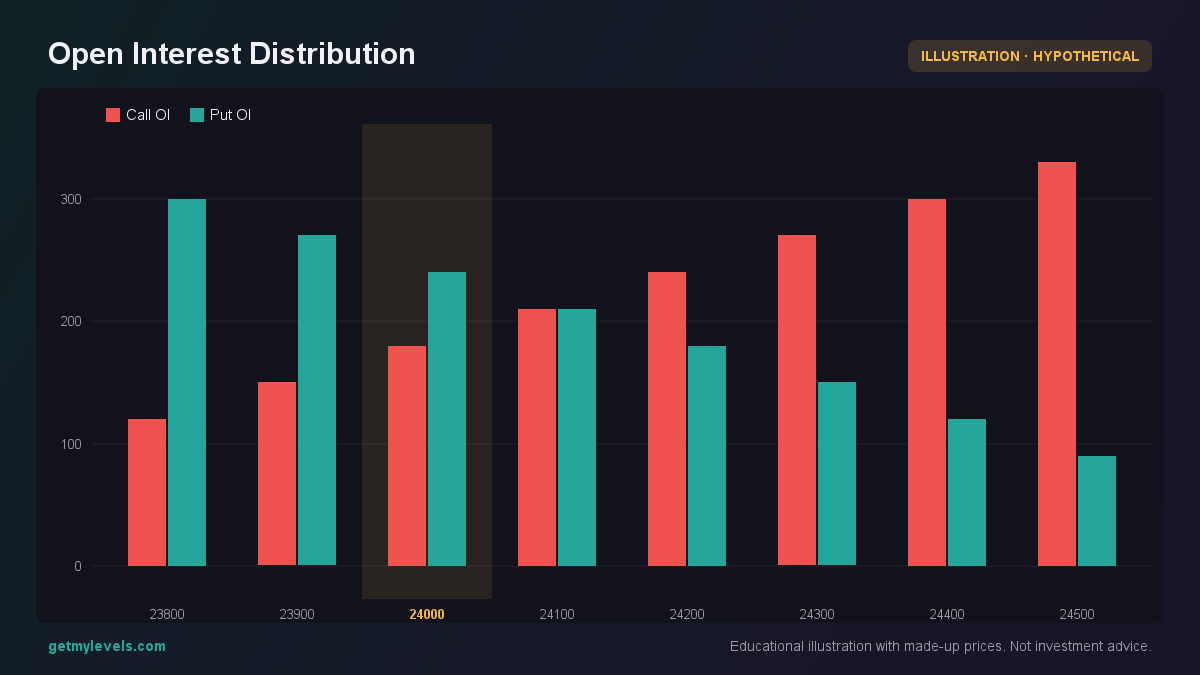 Figure 3: Call and put OI around the 24,000 level.
The figure shows a symmetrical OI distribution, suggesting a balanced market environment. In such a context, placing the short legs at 24,500 (call) and 23,500 (put) aligns the strategy with the nearest institutional resistance and support zones, respectively. The long legs at 24,200 and 23,800 sit just below and above the support zone, providing a buffer if the index moves beyond the short strikes.
By aligning the ladder with the institutional zones, you increase the likelihood that the short legs will benefit from the normal price oscillation within the zone, while the long legs protect against larger moves that break the zone.
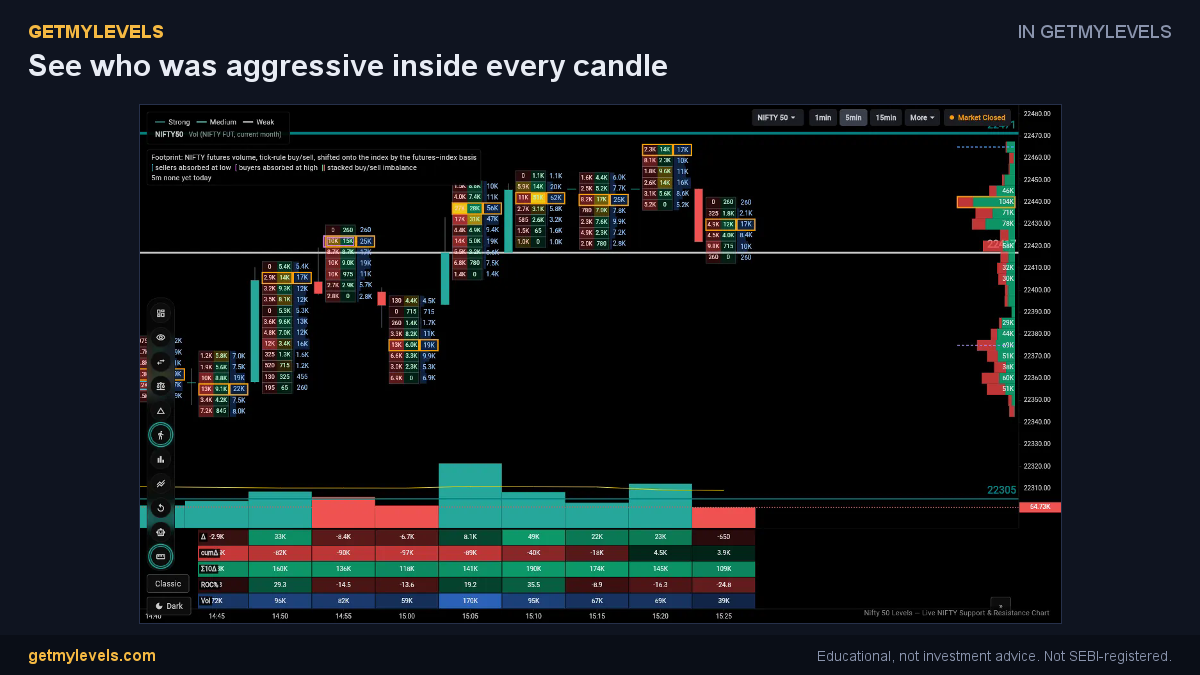 In GetMyLevels: See who was aggressive inside every candle. The live chart draws this for NIFTY, BANK NIFTY and SENSEX.
Summary
- A risk-managed ladder balances premium from short legs with protection from long legs.
- Delta neutrality keeps the position relatively immune to small price changes.
- Gamma ensures that protection strengthens as the index moves away from the short strikes.
- Theta decay works in favour of the short legs, but the long legs also lose value over time.
- Aligning the ladder strikes with institutional support and resistance zones improves the probability that the short legs will capture time decay while the long legs serve as a safety net.
When you are ready to test a ladder, you can use live NIFTY, BANK NIFTY or SENSEX charts that display institutional zones and option-chain OI in real time. GetMyLevels provides these features on its platform, letting you see the zones you need to watch and the option-chain data you need to build the ladder. No method removes risk; results vary with market conditions.
Written by an AI agent from GetMyLevels level data and checked by automated compliance rules. Educational, not investment advice. Not SEBI-registered.