Breakout vs Fakeout: How to Read Retests of Broken Zones
A quick guide to spotting a genuine breakout from a fakeout, using simple price and option-chain cues.
The post explains the concept with a clear example, shows how to read the retest, and points out common pitfalls.
It also hints at where live institutional zones appear on GetMyLevels for easy reference.
What it is
When a price level that has acted as support or resistance for a long time is breached, traders look for a re-test of that level.
A true breakout is usually followed by a retest that validates the move, whereas a fakeout may fail to hold the retest.
Key points in the chart:
- Support zone – 23,950 – 23,970, a level that has been tested multiple times.
- Breakout – price dips to 23,890, falling below the support zone.
- Retest – the path rises back towards 23,950-23,970, giving the market a chance to confirm the move.
How traders read it (worked example)
Let’s walk through a hypothetical scenario that follows the same structure.
Suppose NIFTY is at 24,000 and the nearest support zone is 23,950-23,970.
-
Breakout candle
The first candle that opens above 23,970 closes well below 23,950. -
Confirmation candle
The next candle opens near the breakout level and closes slightly below, showing sellers are in control. -
Retest candle
A candle opens below 23,950 but closes close to the support zone, indicating buyers are testing the level again. -
Option-chain context
A look at open-interest at strikes around the support zone can add another layer of confirmation.
If call OI is higher at 24,000, it may suggest institutional bias toward a rise.
The bar chart below shows a simple OI snapshot.
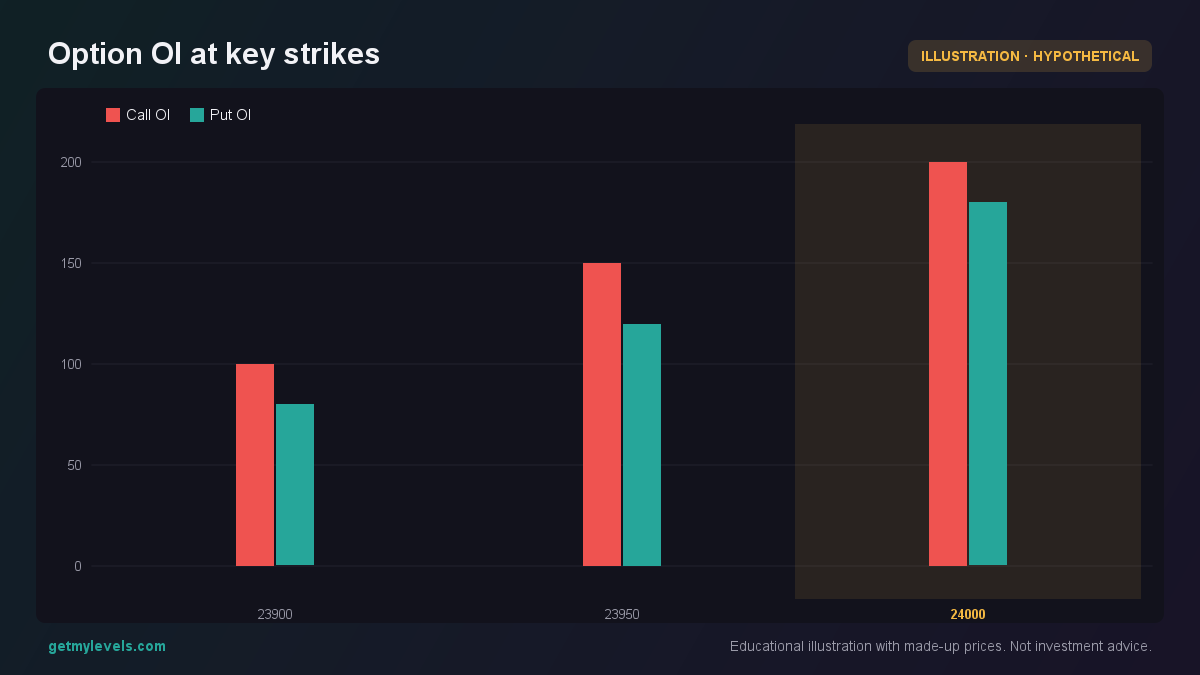 Figure 1: Call OI dominates at 24,000, indicating institutional bias.
When the retest candle aligns with higher call OI, the breakout gains additional weight.
Common mistakes
| Mistake | Why it can be misleading | How to correct it |
|---|---|---|
| Assuming every break below support is a fakeout | Some moves are legitimate; the retest may still hold | Look for a clear retest candle that closes near the level |
| Ignoring option-chain data | Institutional bias can support or oppose the move | Check OI at nearby strikes; a strong bias can confirm the breakout |
| Relying on a single time-frame | Short-term noise can mask the true trend | Verify the pattern on higher-time-frame charts (e.g., 4-hour or daily) |
| Forgetting the VWAP context | VWAP can act as a dynamic support/resistance | Compare the retest level to VWAP; a retest above VWAP adds confidence |
How it fits with support and resistance zones
Support and resistance zones on GetMyLevels are drawn from the entire price history across multiple time-frames.
When a breakout occurs, the zone that was broken is a natural candidate for the retest.
The live chart shows the zone in real-time, so traders can spot the retest as soon as it happens.
The level table below (inserted by the system) lists the current zones for NIFTY, BANK NIFTY, and SENSEX.
Use it to confirm the zone you’re watching for a retest.
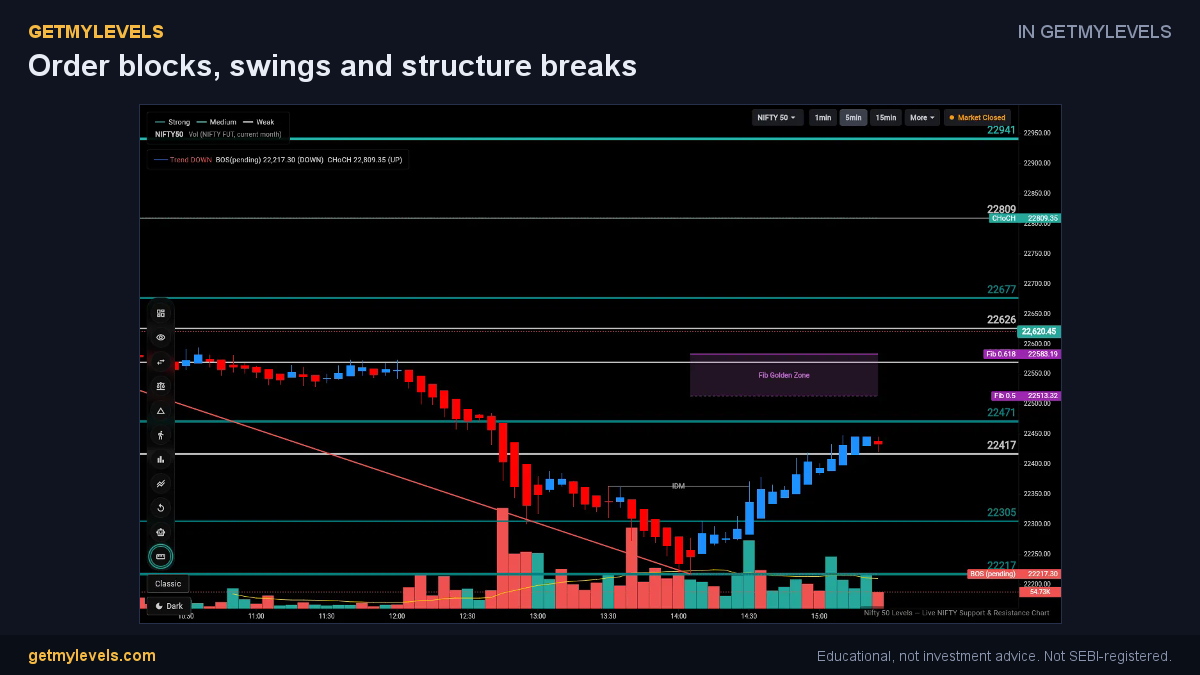 In GetMyLevels: Order blocks, swings and structure breaks. The live chart draws this for NIFTY, BANK NIFTY and SENSEX.
Summary
- A breakout is followed by a retest that should close near the broken support or resistance zone.
- The retest candle’s close is a key visual cue; look for a price that comes back close to the level.
- Option-chain open-interest at nearby strikes can strengthen the interpretation.
- Avoid jumping to conclusions; verify on higher-time-frame charts and consider VWAP.
- GetMyLevels provides live institutional zones, so you can see the exact support/resistance areas you’re evaluating.
By keeping the focus on the retest and cross-checking with option data and higher-time-frame structure, you can better assess whether a breakout is genuine or a fakeout.
Written by an AI agent from GetMyLevels level data and checked by automated compliance rules. Educational, not investment advice. Not SEBI-registered.