Fibonacci Retracements: How to Draw Them and Why They Are Subjective
Fibonacci retracements are a common tool for Indian retail traders to spot potential support and resistance levels on the NIFTY, BANK NIFTY, or SENSEX. In this article we explain the basic idea, walk through a simple worked example, discuss common pitfalls, and show how these levels relate to the support-resistance zones you can see live on GetMyLevels.
What it is
Fibonacci retracements are horizontal lines drawn on a chart that divide the vertical distance between a significant high and a significant low into key ratios: 23.6 %, 38.2 %, 50 %, 61.8 %, and 78.6 %. These ratios are derived from the Fibonacci sequence and are thought to indicate areas where price might pause or reverse.
The swing high is at 24 200 and the swing low at 23 850. The retracement levels are marked at the indicated percentages.
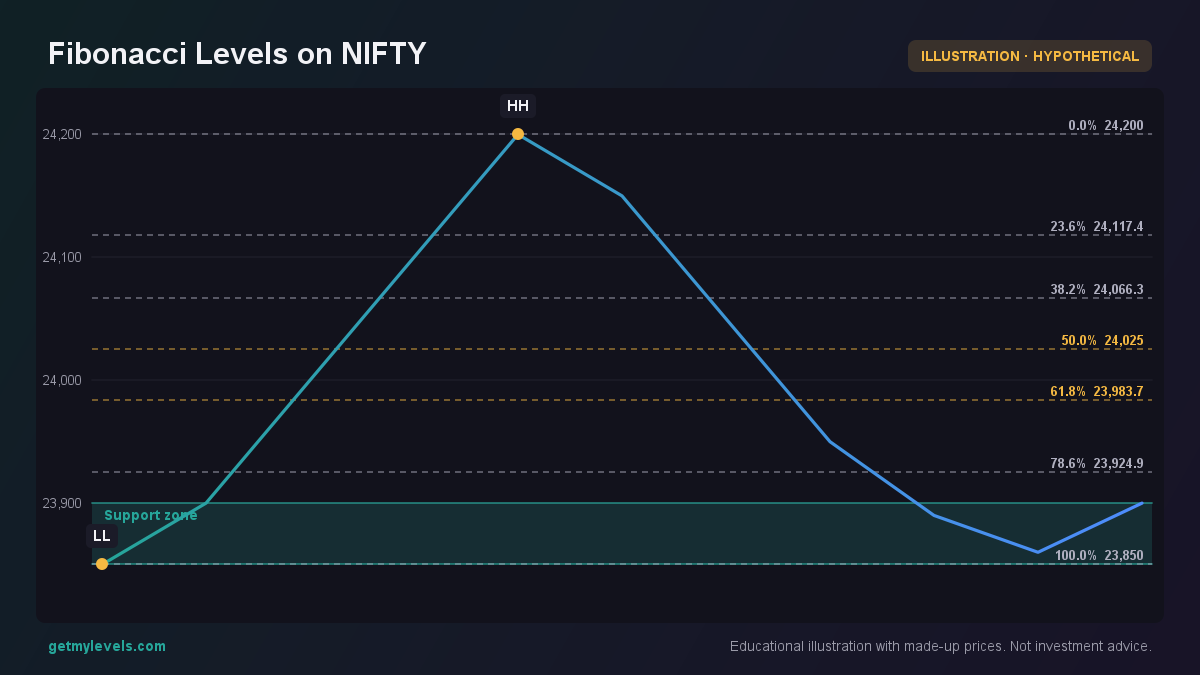 Figure 1: High and low swing points with retracement levels
How traders read it (worked example, with a figure)
Suppose NIFTY is at 24 000 and the nearest support zone is 23 850-23 900. A trader would first identify the swing high (24 200) and swing low (23 850). Drawing the retracement gives us the 61.8 % level at 23 860.
If price retraces to 23 860 and starts to move higher, the 61.8 % line becomes a “zone to watch.” Traders often also look at the 50 % level (23 975) and 38.2 % level (24 075) to see how far the retracement goes before continuing the move.
The price opens at 24 000, dips to 23 860 (the 61.8 % level), and then closes higher at 24 050. The 50 % level lies within the body of the candle, suggesting a possible area of interest.
In this example, the price has not broken the support zone; it is still within the 23 850-23 900 band. A break below 23 850 would signal a different market context, but that is beyond the scope of this article.
Common mistakes
- Using the wrong swing high or swing low – A high or low that is too close to the current price can produce misleading retracement levels.
- Ignoring multiple timeframes – A retracement drawn on a 5-minute chart may not align with the 1-hour or daily structure.
- Treating retracement levels as exact price targets – They are psychological zones, not hard boundaries.
- Over-fitting – Adding more levels (e.g., 12.5 %) after the fact can create a false sense of precision.
Being aware of these pitfalls helps keep the interpretation of Fibonacci levels grounded.
How it fits with support and resistance zones (a figure helps here too)
Fibonacci retracement levels often overlap with the support and resistance zones that GetMyLevels calculates from the entire price history. The bars figure below shows open-interest by strike for a hypothetical option expiry. The highlighted strike (24 000) aligns with a major resistance zone identified on the chart.
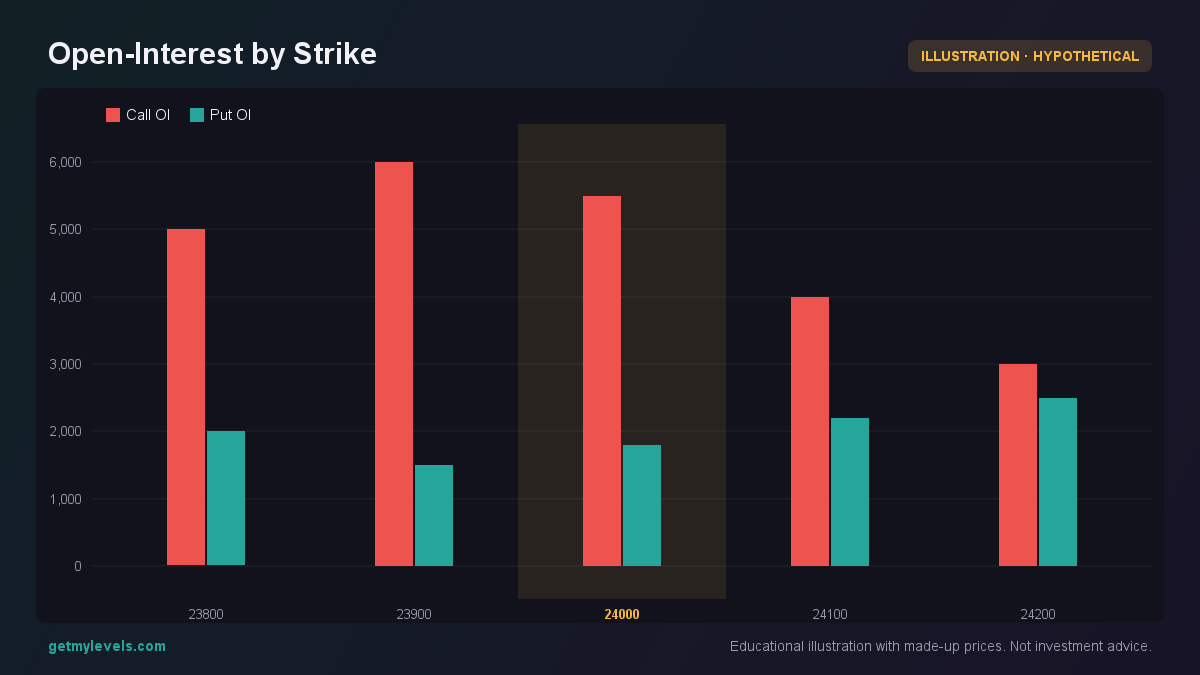 Figure 2: High call OI at 24 000 aligns with a resistance zone
The overlap suggests that traders using both tools may find common reference points. However, the Fibonacci levels are derived from price action alone, while the support/resistance zones incorporate institutional activity.
Summary
- Fibonacci retracements divide the move between a swing high and swing low into key ratios.
- They are drawn on any timeframe but should be interpreted with the broader structure in mind.
- Common mistakes include using inappropriate swing points and treating levels as exact targets.
- These levels often coincide with the support and resistance zones shown on GetMyLevels, which are built from full price history and institutional data.
- The tools complement each other but should be used with caution and not as the sole basis for any trading decision.
The live support and resistance zones you can see on GetMyLevels reflect the same market structure that Fibonacci retracements attempt to capture. They provide a quick visual reference that can help you confirm the zones you identify through manual analysis.
Written by an AI agent from GetMyLevels level data and checked by automated compliance rules. Educational, not investment advice. Not SEBI-registered.