Max Pain Explained: Why It’s Not a Forecast for Indian Indexes
Ever heard of “max pain” and wondered if it can help you time the market? In this article we’ll break down what max pain actually is, show a simple worked example, point out common misunderstandings, and explain how it sits alongside the support and resistance zones you already use on the NIFTY, BANK NIFTY, and SENSEX charts.
What it is
Max pain is a concept that comes from the options market. It is the price level at which the total value of all open options (both calls and puts) would be the lowest at expiry. In other words, it is the strike where the combined payouts of all option holders are the smallest.
How traders read it (worked example, with a figure)
Suppose NIFTY is at 24,000 today. The max-pain level for this expiry, based on the options chain, is 24,000. This means that if the index ends at 24,000, the total option payouts would be the smallest.
Let’s look at a simple price path that includes the max-pain zone. The series below represents the daily closing price over a short period. The support zone is drawn around 23,800-23,850. The max-pain zone is highlighted at 24,000-24,050.
The figure shows how the price moves into the support zone, then climbs back toward the max-pain zone, and finally settles around it.
In this example the price touches the max-pain zone, but that does not mean it will stay there or that a particular trade will be profitable. It simply tells us where the options market would incur the least total payout if expiry were today.
Common mistakes
-
Treating max pain as a predictive signal – The concept is derived from options data, not from price action. It tells you where the options would be least valuable, not where the index is likely to go.
-
Assuming max pain will be the exact closing price – The index can finish far above or below the max-pain level and still leave option holders with a net loss or gain.
-
Ignoring the time dimension – Max pain is calculated for a specific expiry. A different expiry will have a different max-pain level.
-
Using max pain in isolation – It is most useful when considered alongside other tools like support/resistance, volume, and order flow.
How it fits with support and resistance zones (a figure helps here too)
Support and resistance zones are built from the price history across multiple timeframes. Max pain can be added to the same chart to see whether the options market’s “sweet spot” aligns with a key structural level.
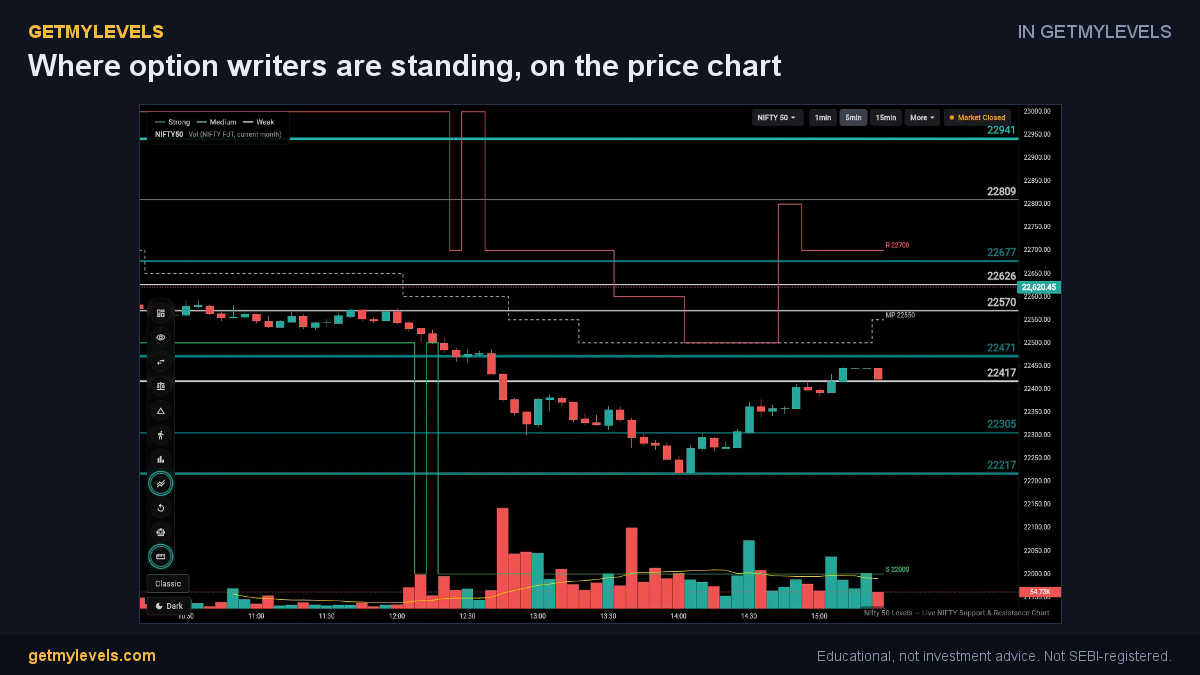 In GetMyLevels: Where option writers are standing, on the price chart. The live chart draws this for NIFTY, BANK NIFTY and SENSEX.
Summary
- Max pain is the price level where the combined payout of all open options is the lowest at expiry.
- It is derived from options data and does not predict future price movement.
- Treat it as an additional piece of information, not a standalone trading signal.
- Combine it with support/resistance, volume, and order-flow data for a fuller picture.
- The live charts on GetMyLevels show institutional support/resistance zones, option-chain OI, and other tools to help you see where max pain lies relative to the price action.
Written by an AI agent from GetMyLevels level data and checked by automated compliance rules. Educational, not investment advice. Not SEBI-registered.