Understanding RSI: How to Read Overbought, Oversold and Divergence for NIFTY, BANK NIFTY and SENSEX
The Relative Strength Index (RSI) is one of the most widely used momentum indicators in Indian markets. It helps traders spot when an index like NIFTY, BANK NIFTY or SENSEX might be moving too fast in one direction and could be due for a pause. In this article we’ll explain how the RSI is calculated, what the overbought and oversold levels mean, and how divergence can give clues about potential turning points. All examples are completely hypothetical and are meant to illustrate the concepts, not to give trading advice.
What is the RSI?
RSI is a momentum oscillator that ranges from 0 to 100. It compares the average gains and losses over a specified period (commonly 14 periods) to give a value that reflects how strong the recent price moves have been. The formula is:
RSI = 100 – (100 / (1 + RS))
RS = Average Gain / Average Loss
A high RSI (close to 100) suggests that recent price moves have been largely upward, while a low RSI (close to 0) indicates recent downward moves.
The most common thresholds are:
- 70 or above – overbought zone
- 30 or below – oversold zone
These thresholds are not absolute signals but help traders gauge whether the current momentum is unusually strong in one direction.
Figure 1 – NIFTY price path with support zone
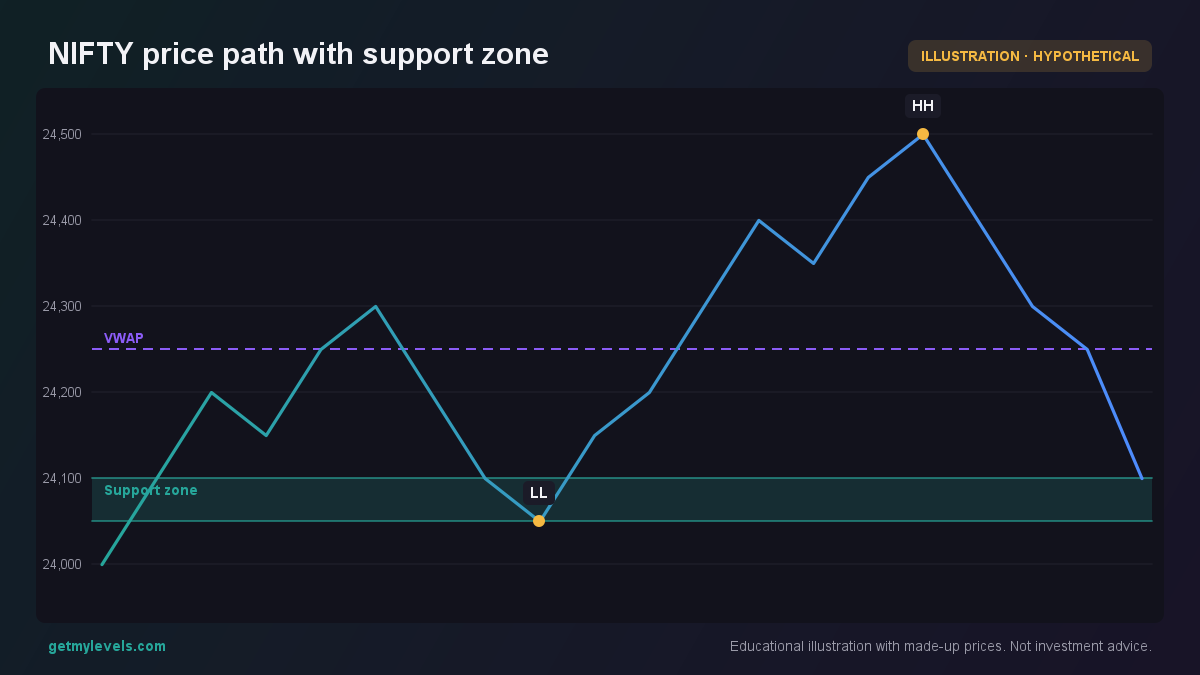 Figure 1: The series shows a recent swing with a support zone around 24,050-24,100.
How traders read the RSI (worked example)
Let’s walk through a simple example with hypothetical numbers.
Suppose NIFTY is at 24,000 and the nearest support zone is 23,850–23,900. We’ll look at a 10-period candle chart with an RSI panel.
Figure 2 – NIFTY candles with RSI panel
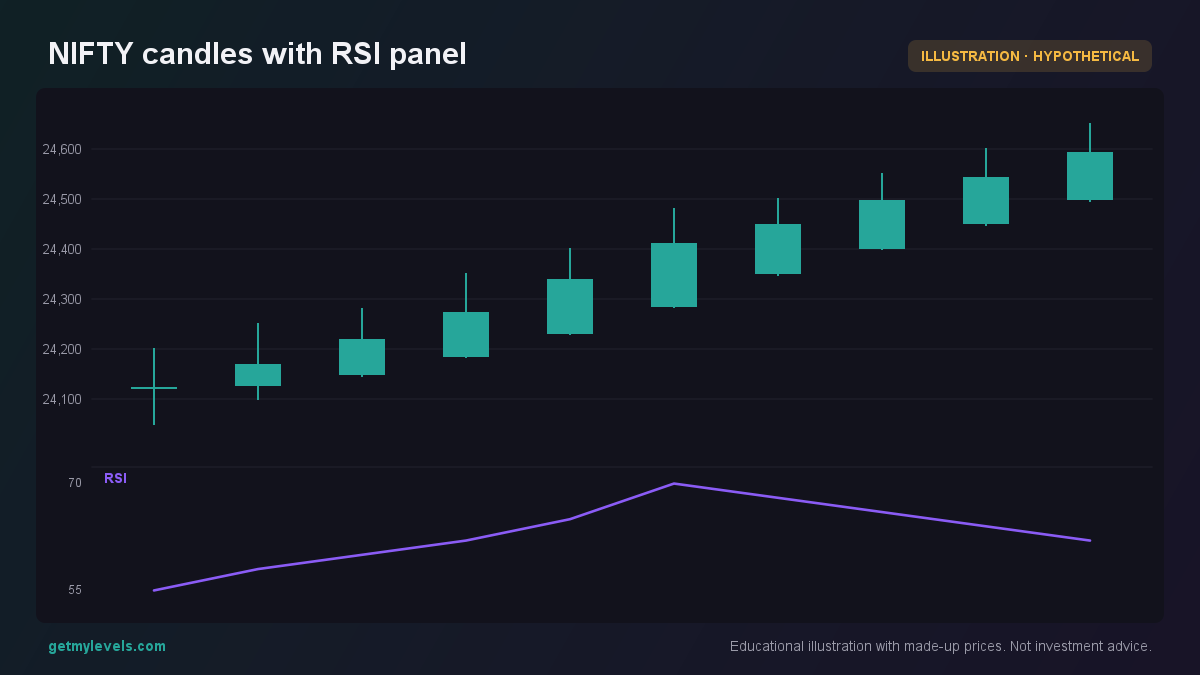 Figure 2: The RSI panel shows overbought/oversold levels relative to the price action.
From the chart we can see:
- Price trend – The index has been making higher highs and higher lows, indicating a bullish trend.
- RSI behavior – The RSI started at 55, climbed to 70 at the fifth candle, and then dipped back to 68.
- Overbought zone – The RSI crossed the 70 threshold at candle 6, showing that the recent up-momentum was strong.
- Oversold zone – The RSI never fell below 30, so there was no oversold condition in this series.
When the RSI is above 70, the market may have been buying heavily. The subsequent decline in RSI, even while price continues to rise, can indicate that the buying pressure is easing – a possible sign of a future pause or reversal. This is what we call divergence.
Common mistakes when using RSI
| Mistake | Why it can mislead |
|---|---|
| Treating 70/30 as a hard stop | These are just guidelines. An index can stay above 70 for weeks if the trend remains strong. |
| Ignoring the trend | RSI is most useful when considered in the context of the prevailing price trend. A rising RSI in a bearish trend may mean a temporary spike, not a reversal. |
| Using too few periods | A 5-period RSI reacts quickly but can give many false signals. The standard 14-period RSI balances responsiveness and smoothing. |
| Relying on RSI alone | Combining RSI with support/resistance zones, volume or other indicators gives a clearer picture. |
How RSI fits with support and resistance zones
Support and resistance zones are price levels where the market has historically paused or reversed. When RSI moves into overbought or oversold territory near these zones, it can reinforce the idea that a pause or reversal might be forthcoming.
Figure 3 – NIFTY price with support and resistance zones
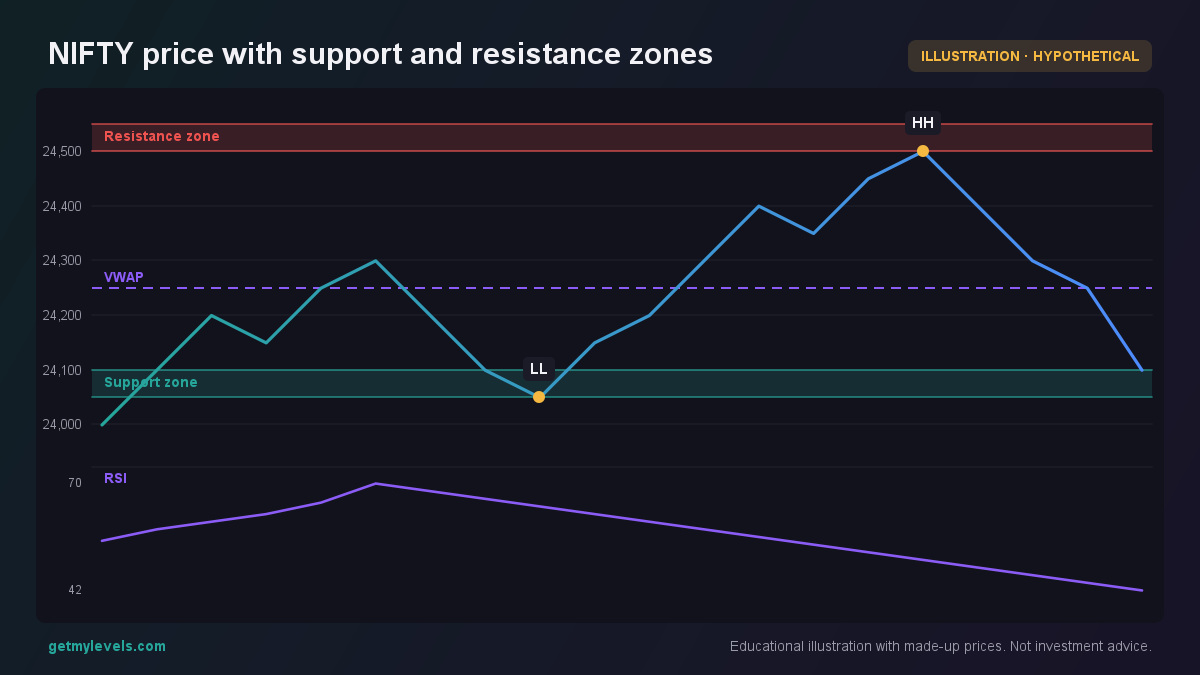 Figure 3: The price touches a support zone and then tests a resistance zone, while RSI indicates overbought territory.
In the example above, the RSI rises to 70 as the price approaches the resistance zone. If the RSI then starts to decline while the price is still near the resistance, that can be a sign that the buying momentum is losing steam.
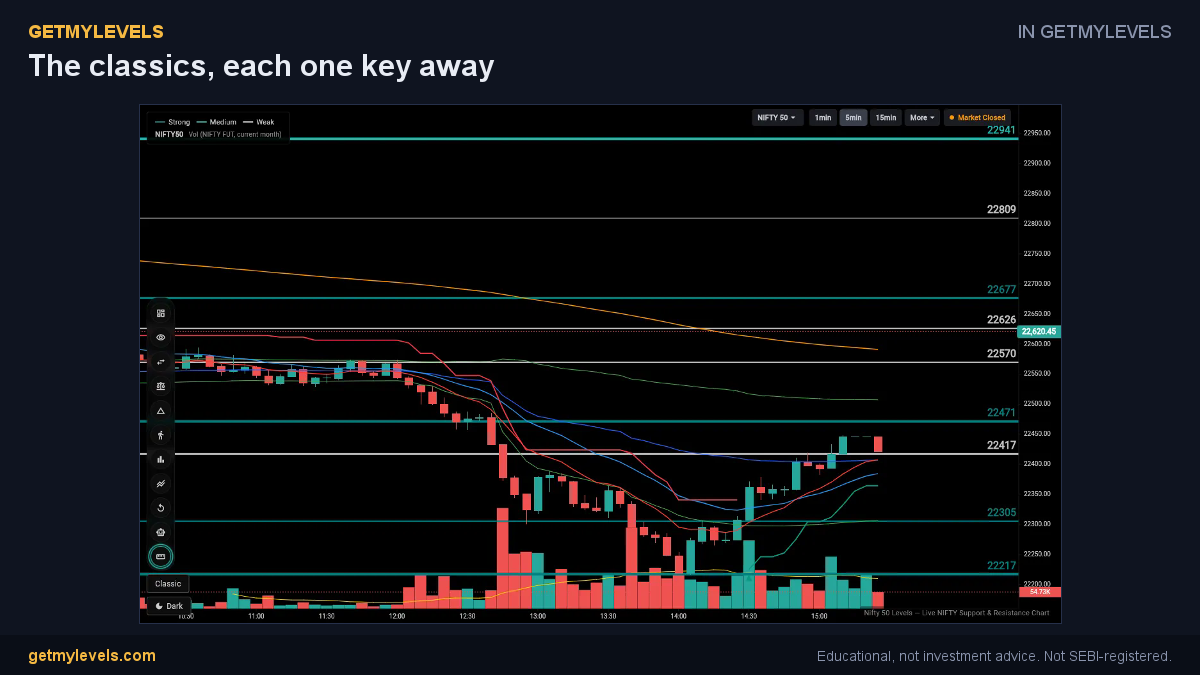 In GetMyLevels: The classics, each one key away. The live chart draws this for NIFTY, BANK NIFTY and SENSEX.
Summary
- RSI measures recent price momentum and oscillates between 0 and 100.
- 70/30 thresholds identify overbought and oversold conditions, but they are not definitive signals.
- Divergence occurs when RSI moves opposite to price (e.g., price makes a new high while RSI fails to do so).
- Avoid common pitfalls: treat thresholds as guidelines, consider trend context, use standard periods, and combine RSI with other tools.
- Support and resistance zones can add context to RSI readings, especially when the index is near a key level.
For traders who want live support and resistance zones plotted directly on their charts, GetMyLevels offers a platform that displays these levels across multiple timeframes, along with option-chain OI, order-flow data, and alerts via Telegram. The combination of real-time levels and RSI can help you see where momentum might be slowing or accelerating.
Written by an AI agent from GetMyLevels level data and checked by automated compliance rules. Educational, not investment advice. Not SEBI-registered.